Analyse protein interaction network for significant hits
Source:R/analyse_functional_network.R
analyse_functional_network.RdThe STRING database provides a resource for known and predicted protein-protein interactions.
The type of interactions include direct (physical) and indirect (functional) interactions.
Through the R package STRINGdb this resource if provided to R users. This function
provides a convenient wrapper for STRINGdb functions that allow an easy use within the
protti pipeline.
analyse_functional_network(
  data,
  protein_id,
  string_id,
  organism_id,
  version = "12.0",
  score_threshold = 900,
  binds_treatment = NULL,
  halo_color = NULL,
  plot = TRUE
)
Arguments
- data
a data frame that contains significantly changing proteins (STRINGdb is only able to plot 400 proteins at a time so do not provide more for network plots). Information about treatment binding can be provided and will be displayed as colorful halos around the proteins in the network.
- protein_id
a character column in the
datadata frame that contains the protein accession numbers.- string_id
a character column in the
datadata frame that contains STRING database identifiers. These can be obtained from UniProt.- organism_id
a numeric value specifying an organism ID (NCBI taxon-ID). This can be obtained from here. H. sapiens: 9606, S. cerevisiae: 4932, E. coli: 511145.
- version
a character value that specifies the version of STRINGdb to be used. Default is 12.0.
- score_threshold
a numeric value specifying the interaction score that based on STRING has to be between 0 and 1000. A score closer to 1000 is related to a higher confidence for the interaction. The default value is 900.
- binds_treatment
a logical column in the
datadata frame that indicates if the corresponding protein binds to the treatment. This information can be obtained from different databases, e.g UniProt.- halo_color
optional, character value with a color hex-code. This is the color of the halo of proteins that bind the treatment.
- plot
a logical that indicates whether the result should be plotted or returned as a table.
Value
A network plot displaying interactions of the provided proteins. If
binds_treatment was provided halos around the proteins show which proteins interact with
the treatment. If plot = FALSE a data frame with interaction information is returned.
Examples
# \donttest{
# Create example data
data <- data.frame(
uniprot_id = c(
"P0A7R1",
"P02359",
"P60624",
"P0A7M2",
"P0A7X3",
"P0AGD3"
),
xref_string = c(
"511145.b4203;",
"511145.b3341;",
"511145.b3309;",
"511145.b3637;",
"511145.b3230;",
"511145.b1656;"
),
is_known = c(
TRUE,
TRUE,
TRUE,
TRUE,
TRUE,
FALSE
)
)
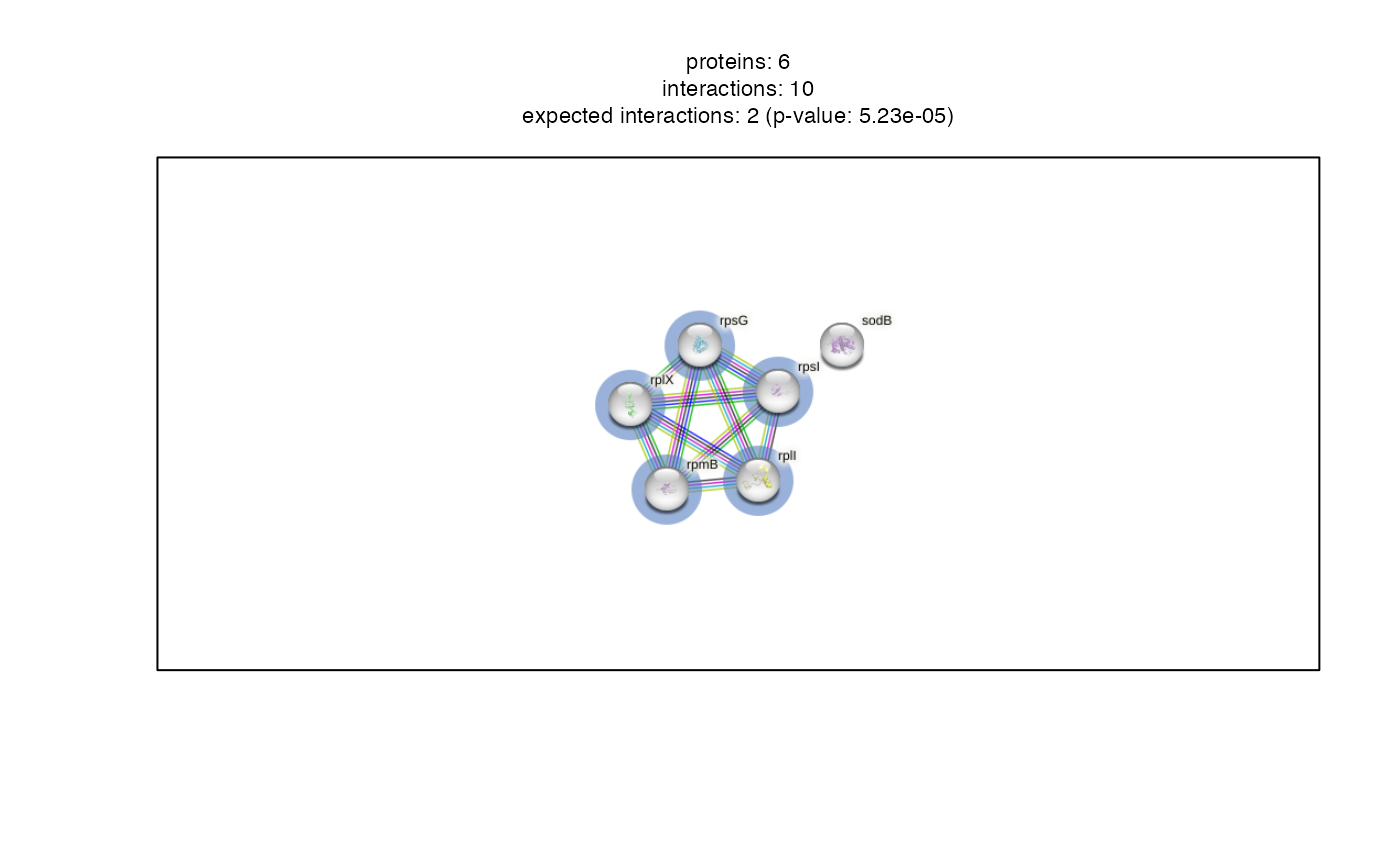
# Perform network analysis
network <- analyse_functional_network(
data,
protein_id = uniprot_id,
string_id = xref_string,
organism_id = 511145,
binds_treatment = is_known,
plot = TRUE
)
 network
#> NULL
# }
network
#> NULL
# }