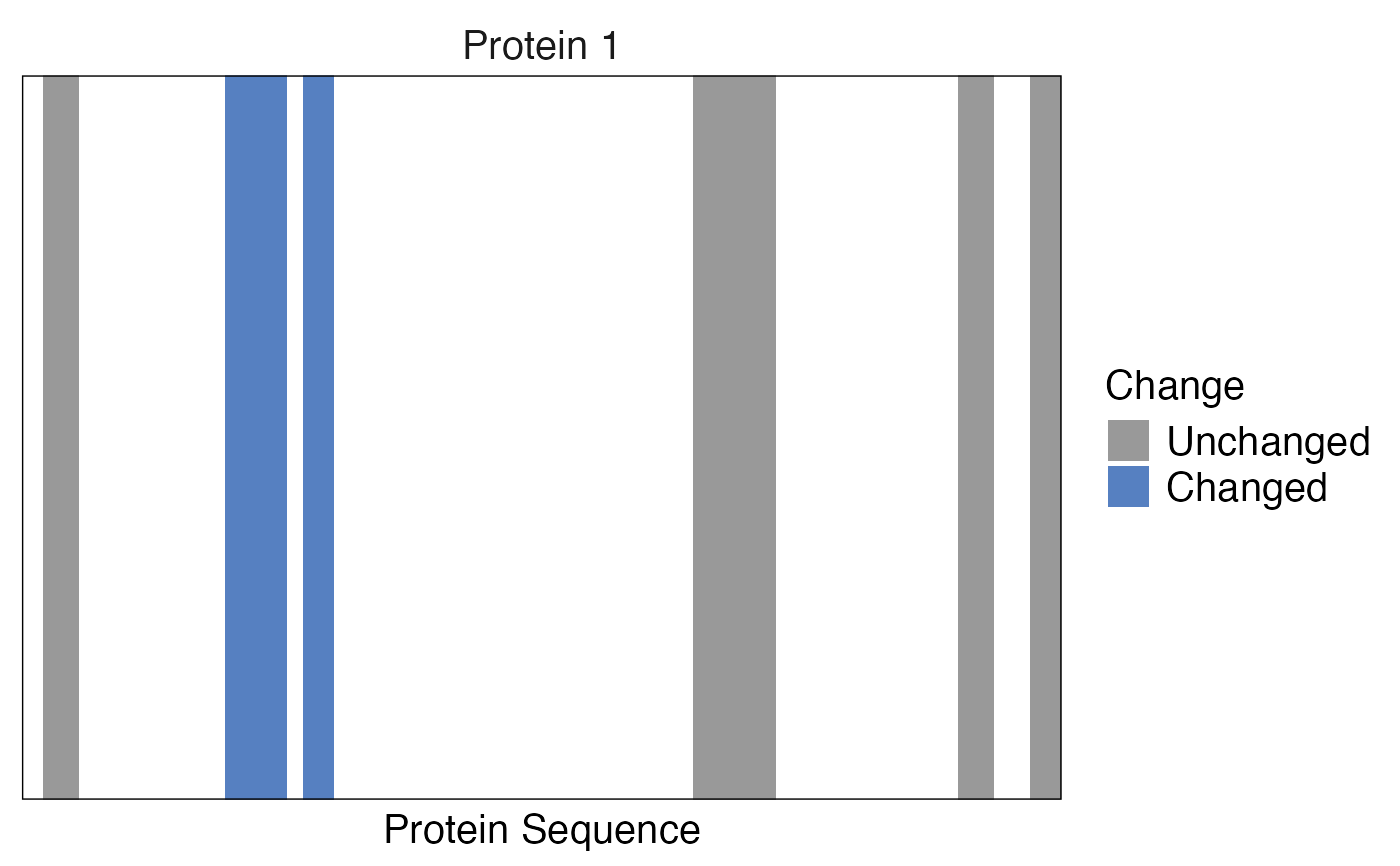
Plots a "barcode plot" - a vertical line for each identified peptide. Peptides can be colored based on an additional variable. Also differential abundance can be displayed.
barcode_plot(
  data,
  start_position,
  end_position,
  protein_length,
  coverage = NULL,
  colouring = NULL,
  fill_colour_gradient = protti::mako_colours,
  fill_colour_discrete = c("#999999", protti::protti_colours),
  protein_id = NULL,
  facet = NULL,
  facet_n_col = 4,
  cutoffs = NULL
)
Arguments
- data
a data frame containing differential abundance, start and end peptide or precursor positions and protein length.
- start_position
a numeric column in the data frame containing the start positions for each peptide or precursor.
- end_position
a numeric column in the data frame containing the end positions for each peptide or precursor.
- protein_length
a numeric column in the data frame containing the length of the protein.
- coverage
optional, numeric column in the data frame containing coverage in percent. Will appear in the title of the barcode if provided.
- colouring
optional, column in the data frame containing information by which peptide or precursors should be colored.
- fill_colour_gradient
a vector that contains colours that should be used to create a colour gradient for the barcode plot bars if the
colouringargument is continuous. Default ismako_colours.- fill_colour_discrete
a vector that contains colours that should be used to fill the barcode plot bars if the
colouringargument is discrete. Default isprotti_colours.- protein_id
optional, column in the data frame containing protein identifiers. Required if only one protein should be plotted and the data frame contains only information for this protein.
- facet
optional, column in the data frame containing information by which data should be faceted. This can be protein identifiers. Only 20 proteins are plotted at a time, the rest is ignored. If more should be plotted, a mapper over a subsetted data frame should be created.
- facet_n_col
a numeric value that specifies the number of columns the faceted plot should have if a column name is provided to group. The default is 4.
- cutoffs
optional argument specifying the log2 fold change and significance cutoffs used for highlighting peptides. If this argument is provided colouring information will be overwritten with peptides that fulfill this condition. The cutoff should be provided in a vector of the form c(diff = 2, pval = 0.05). The name of the cutoff should reflect the column name that contains this information (log2 fold changes, p-values or adjusted p-values).
Value
A barcode plot is returned.
Examples
data <- data.frame(
  start = c(5, 40, 55, 130, 181, 195),
  end = c(11, 51, 60, 145, 187, 200),
  length = rep(200, 6),
  pg_protein_accessions = rep("Protein 1", 6),
  diff = c(1, 2, 5, 2, 1, 1),
  pval = c(0.1, 0.01, 0.01, 0.2, 0.2, 0.01)
)

barcode_plot(
  data,
  start_position = start,
  end_position = end,
  protein_length = length,
  facet = pg_protein_accessions,
  cutoffs = c(diff = 2, pval = 0.05)
)