Check treatment enrichment
Source:R/calculate_treatment_enrichment.R
calculate_treatment_enrichment.RdCheck for an enrichment of proteins interacting with the treatment in significantly changing proteins as compared to all proteins.
calculate_treatment_enrichment(
  data,
  protein_id,
  is_significant,
  binds_treatment,
  group = NULL,
  treatment_name,
  plot = TRUE,
  fill_colours = protti::protti_colours,
  fill_by_group = FALSE,
  facet_n_col = 2
)
Arguments
- data
a data frame contains at least the input variables.
- protein_id
a character column in the
datadata frame that contains the protein accession numbers.- is_significant
a logical column in the
datadata frame that indicates if the corresponding protein has a significantly changing peptide. The input data frame may contain peptide level information with significance information. The function is able to extract protein level information from this.- binds_treatment
a logical column in the
datadata frame that indicates if the corresponding protein binds to the treatment. This information can be obtained from different databases, e.g. UniProt.- group
optional, character column in the
datadata frame that contains information by which the analysis should be grouped. The analysis will be performed separately for each of the groups. This is most likely a column that labels separate comparisons of different conditions. In protti theassign_missingness()function creates such a column automatically.- treatment_name
a character value that indicates the treatment name. It will be included in the plot title.
- plot
a logical value indicating whether the result should be plotted or returned as a table.
- fill_colours
a character vector that specifies the fill colours of the plot.
- fill_by_group
a logical value that specifies if the bars in the plot should be filled by group if the group argument is provided. Default is
FALSE.- facet_n_col
a numeric value that specifies the number of columns the facet plot should have if a
groupcolumn was provided.
Value
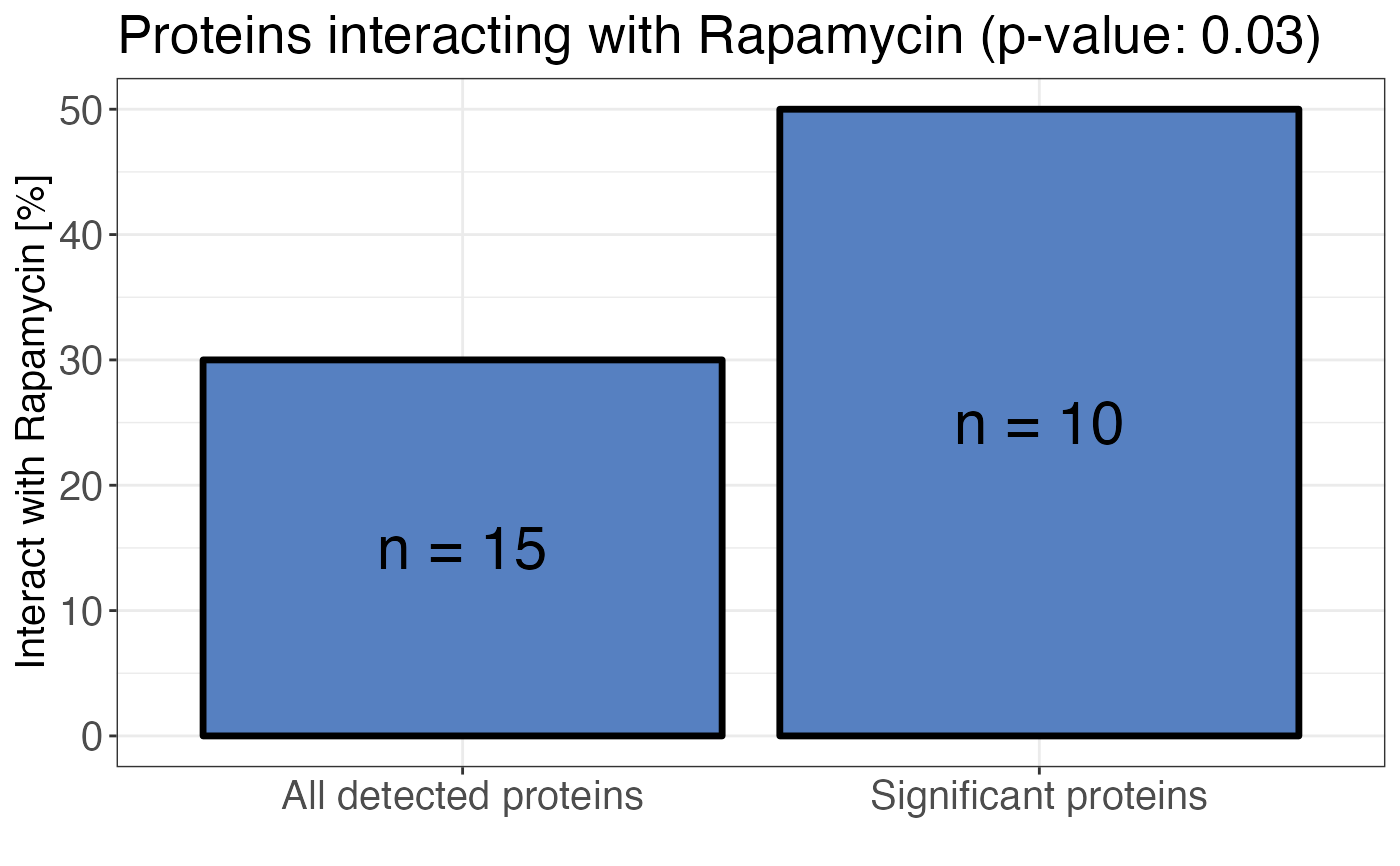
A bar plot displaying the percentage of all detected proteins and all significant proteins
that bind to the treatment. A Fisher's exact test is performed to calculate the significance of
the enrichment in significant proteins compared to all proteins. The result is reported as a
p-value. If plot = FALSE a contingency table in long format is returned.
Examples
# Create example data
data <- data.frame(
protein_id = c(paste0("protein", 1:50)),
significant = c(
rep(TRUE, 20),
rep(FALSE, 30)
),
binds_treatment = c(
rep(TRUE, 10),
rep(FALSE, 10),
rep(TRUE, 5),
rep(FALSE, 25)
),
group = c(
rep("A", 5),
rep("B", 15),
rep("A", 15),
rep("B", 15)
)
)
# Plot treatment enrichment
calculate_treatment_enrichment(
data,
protein_id = protein_id,
is_significant = significant,
binds_treatment = binds_treatment,
treatment_name = "Rapamycin",
plot = TRUE
)
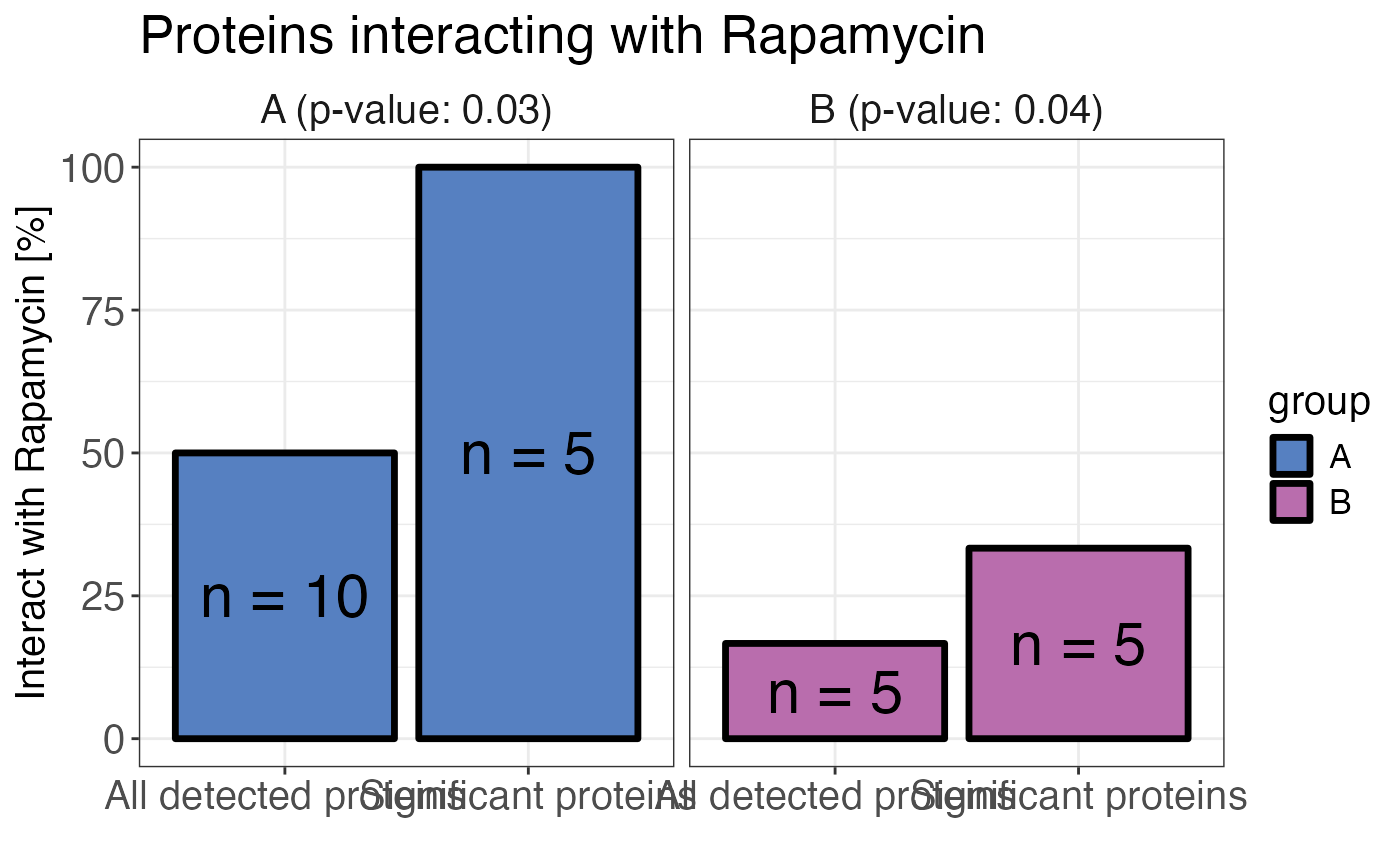
 # Plot treatment enrichment by group
calculate_treatment_enrichment(
data,
protein_id = protein_id,
group = group,
is_significant = significant,
binds_treatment = binds_treatment,
treatment_name = "Rapamycin",
plot = TRUE,
fill_by_group = TRUE
)
# Plot treatment enrichment by group
calculate_treatment_enrichment(
data,
protein_id = protein_id,
group = group,
is_significant = significant,
binds_treatment = binds_treatment,
treatment_name = "Rapamycin",
plot = TRUE,
fill_by_group = TRUE
)
 # Calculate treatment enrichment
enrichment <- calculate_treatment_enrichment(
data,
protein_id = protein_id,
is_significant = significant,
binds_treatment = binds_treatment,
plot = FALSE
)
enrichment
#> # A tibble: 4 × 4
#> binds_treatment significant n pval
#> <lgl> <lgl> <int> <dbl>
#> 1 FALSE FALSE 25 0.0255
#> 2 FALSE TRUE 10 0.0255
#> 3 TRUE FALSE 5 0.0255
#> 4 TRUE TRUE 10 0.0255
# Calculate treatment enrichment
enrichment <- calculate_treatment_enrichment(
data,
protein_id = protein_id,
is_significant = significant,
binds_treatment = binds_treatment,
plot = FALSE
)
enrichment
#> # A tibble: 4 × 4
#> binds_treatment significant n pval
#> <lgl> <lgl> <int> <dbl>
#> 1 FALSE FALSE 25 0.0255
#> 2 FALSE TRUE 10 0.0255
#> 3 TRUE FALSE 5 0.0255
#> 4 TRUE TRUE 10 0.0255