Function for plotting four-parameter dose response curves for each group (precursor, peptide or
protein), based on output from fit_drc_4p function.
drc_4p_plot(
  data,
  grouping,
  response,
  dose,
  targets,
  unit = "uM",
  y_axis_name = "Response",
  facet_title_size = 15,
  facet = TRUE,
  scales = "free",
  x_axis_scale_log10 = TRUE,
  x_axis_limits = c(NA, NA),
  colours = NULL,
  export = FALSE,
  export_height = 25,
  export_width = 30,
  export_name = "dose-response_curves"
)
Arguments
- data
a data frame that is obtained by calling the
fit_drc_4pfunction.- grouping
a character column in the
datadata frame that contains the precursor, peptide or protein identifiers.- response
a numeric column in a nested data frame called
plot_pointsthat is part of thedatadata frame. This column contains the response values, e.g. log2 transformed intensities.- dose
a numeric column in a nested data frame called
plot_pointsthat is part of thedatadata frame. This column contains the dose values, e.g. the treatment concentrations.- targets
a character vector that specifies the names of the precursors, peptides or proteins (depending on
grouping) that should be plotted. This can also be"all"if plots for all curve fits should be created.- unit
a character value specifying the unit of the concentration.
- y_axis_name
a character value specifying the name of the y-axis of the plot.
- facet_title_size
a numeric value that specifies the size of the facet title. Default is 15.
- facet
a logical value that indicates if plots should be summarised into facets of 20 plots. This is recommended for many plots.
- scales
a character value that specifies if the scales in faceted plots (if more than one target was provided) should be
"free"or"fixed".- x_axis_scale_log10
a logical value that indicates if the x-axis scale should be log10 transformed.
- x_axis_limits
a numeric vector of length 2, defining the lower and upper x-axis limit. The default is
c(NA, NA), meaning the limits are not defined by the user but by the data.- colours
a character vector containing at least three colours. The first is used for the points, the second for the confidence interval and the third for the curve. By default the first two protti colours are used for the points and confidence interval and the curve is black.
- export
a logical value that indicates if plots should be exported as PDF. The output directory will be the current working directory. The name of the file can be chosen using the
export_nameargument. If only one target is selected andexport = TRUE, the plot is exported and in addition returned in R.- export_height
a numeric value that specifies the plot height in inches for an exported plot. The default is
25. For a non-facet plot we recommend using 8.- export_width
a numeric value that specifies the plot height in inches for an exported plot. The default is
30. For a non-facet plot we recommend using 12.- export_name
a character value providing the name of the exported file if
export = TRUE.
Value
If targets = "all" a list containing plots for every unique identifier in the
grouping variable is created. Otherwise a plot for the specified targets is created with
maximally 20 facets.
Examples
# \donttest{
set.seed(123) # Makes example reproducible
# Create example data
data <- create_synthetic_data(
n_proteins = 2,
frac_change = 1,
n_replicates = 3,
n_conditions = 8,
method = "dose_response",
concentrations = c(0, 1, 10, 50, 100, 500, 1000, 5000),
additional_metadata = FALSE
)
# Perform dose response curve fit
drc_fit <- fit_drc_4p(
data = data,
sample = sample,
grouping = peptide,
response = peptide_intensity_missing,
dose = concentration,
retain_columns = c(protein)
)
#> Warning: The `condition_completeness` argument of `fit_drc_4p()` is deprecated as of
#> protti 0.8.0.
#> ℹ Please use the `n_condition_completeness` argument instead.
#> Warning: The `replicate_completeness` argument of `fit_drc_4p()` is deprecated as of
#> protti 0.8.0.
#> ℹ Please use the `n_replicate_completeness` argument instead.
str(drc_fit)
#> tibble [45 × 18] (S3: tbl_df/tbl/data.frame)
#> $ rank : num [1:45] 1 2 3 4 NA NA NA NA NA NA ...
#> $ protein : chr [1:45] "protein_2" "protein_2" "protein_1" "protein_2" ...
#> $ peptide : chr [1:45] "peptide_2_1" "peptide_2_3" "peptide_1_1" "peptide_2_2" ...
#> $ hill_coefficient : num [1:45] 2.23 3.28 1.89 -3.31 -4.66 ...
#> $ min_model : num [1:45] 14.9 12.5 16 19.1 17.4 ...
#> $ max_model : num [1:45] 19.1 16.2 17.1 19.8 17.9 ...
#> $ ec_50 : num [1:45] 245.4 141.8 95.5 629.3 203 ...
#> $ correlation : num [1:45] 0.999 0.994 0.967 0.928 0.769 ...
#> $ pval : num [1:45] 1.13e-29 8.42e-15 1.60e-14 6.63e-11 1.77e-05 ...
#> $ plot_curve :List of 45
#> ..$ : tibble [100 × 4] (S3: tbl_df/tbl/data.frame)
#> .. ..$ dose : num [1:100] 5000 4588 4210 3863 3544 ...
#> .. ..$ Prediction: num [1:100] 14.9 14.9 14.9 14.9 14.9 ...
#> .. ..$ Lower : num [1:100] 14.8 14.8 14.8 14.8 14.8 ...
#> .. ..$ Upper : num [1:100] 15 15 15 15 15 ...
#> ..$ : tibble [100 × 4] (S3: tbl_df/tbl/data.frame)
#> .. ..$ dose : num [1:100] 5000 4588 4210 3863 3544 ...
#> .. ..$ Prediction: num [1:100] 12.5 12.5 12.5 12.5 12.5 ...
#> .. ..$ Lower : num [1:100] 12.2 12.2 12.2 12.2 12.2 ...
#> .. ..$ Upper : num [1:100] 12.7 12.7 12.7 12.7 12.7 ...
#> ..$ : tibble [100 × 4] (S3: tbl_df/tbl/data.frame)
#> .. ..$ dose : num [1:100] 5000 4588 4210 3863 3544 ...
#> .. ..$ Prediction: num [1:100] 16 16 16 16 16 ...
#> .. ..$ Lower : num [1:100] 15.9 15.9 15.9 15.9 15.9 ...
#> .. ..$ Upper : num [1:100] 16.1 16.1 16.1 16.1 16.1 ...
#> ..$ : tibble [100 × 4] (S3: tbl_df/tbl/data.frame)
#> .. ..$ dose : num [1:100] 5000 4588 4210 3863 3544 ...
#> .. ..$ Prediction: num [1:100] 19.8 19.8 19.8 19.8 19.8 ...
#> .. ..$ Lower : num [1:100] 19.7 19.7 19.7 19.7 19.7 ...
#> .. ..$ Upper : num [1:100] 19.9 19.9 19.9 19.9 19.9 ...
#> ..$ : tibble [100 × 4] (S3: tbl_df/tbl/data.frame)
#> .. ..$ dose : num [1:100] 5000 4588 4210 3863 3544 ...
#> .. ..$ Prediction: num [1:100] 17.9 17.9 17.9 17.9 17.9 ...
#> .. ..$ Lower : num [1:100] 17.7 17.7 17.7 17.7 17.7 ...
#> .. ..$ Upper : num [1:100] 18.1 18.1 18.1 18.1 18.1 ...
#> ..$ : tibble [100 × 4] (S3: tbl_df/tbl/data.frame)
#> .. ..$ dose : num [1:100] 5000 4588 4210 3863 3544 ...
#> .. ..$ Prediction: num [1:100] 14.8 14.8 14.8 14.8 14.8 ...
#> .. ..$ Lower : num [1:100] 14.7 14.7 14.7 14.7 14.7 ...
#> .. ..$ Upper : num [1:100] 15 15 15 15 15 ...
#> ..$ : tibble [100 × 4] (S3: tbl_df/tbl/data.frame)
#> .. ..$ dose : num [1:100] 5000 4588 4210 3863 3544 ...
#> .. ..$ Prediction: num [1:100] 15 15 15 15 15 ...
#> .. ..$ Lower : num [1:100] 14.9 14.9 14.9 14.9 14.9 ...
#> .. ..$ Upper : num [1:100] 15.1 15.1 15.1 15.1 15.1 ...
#> ..$ : tibble [100 × 4] (S3: tbl_df/tbl/data.frame)
#> .. ..$ dose : num [1:100] 5000 4588 4210 3863 3544 ...
#> .. ..$ Prediction: num [1:100] 15.7 15.7 15.7 15.7 15.7 ...
#> .. ..$ Lower : num [1:100] NA NA NA NA NA NA NA NA NA NA ...
#> .. ..$ Upper : num [1:100] NA NA NA NA NA NA NA NA NA NA ...
#> ..$ : tibble [100 × 4] (S3: tbl_df/tbl/data.frame)
#> .. ..$ dose : num [1:100] 5000 4588 4210 3863 3544 ...
#> .. ..$ Prediction: num [1:100] 15.8 15.8 15.8 15.8 15.8 ...
#> .. ..$ Lower : num [1:100] 15.6 15.6 15.6 15.6 15.6 ...
#> .. ..$ Upper : num [1:100] 16 16 16 16 16 ...
#> ..$ : tibble [100 × 4] (S3: tbl_df/tbl/data.frame)
#> .. ..$ dose : num [1:100] 5000 4588 4210 3863 3544 ...
#> .. ..$ Prediction: num [1:100] 16.5 16.5 16.5 16.5 16.5 ...
#> .. ..$ Lower : num [1:100] 16.4 16.4 16.4 16.4 16.4 ...
#> .. ..$ Upper : num [1:100] 16.7 16.7 16.7 16.7 16.7 ...
#> ..$ : tibble [100 × 4] (S3: tbl_df/tbl/data.frame)
#> .. ..$ dose : num [1:100] 5000 4588 4210 3863 3544 ...
#> .. ..$ Prediction: num [1:100] 17.6 17.6 17.6 17.6 17.6 ...
#> .. ..$ Lower : num [1:100] 17.5 17.5 17.5 17.5 17.5 ...
#> .. ..$ Upper : num [1:100] 17.7 17.7 17.7 17.7 17.7 ...
#> ..$ : tibble [100 × 4] (S3: tbl_df/tbl/data.frame)
#> .. ..$ dose : num [1:100] 5000 4588 4210 3863 3544 ...
#> .. ..$ Prediction: num [1:100] 16.4 16.4 16.4 16.4 16.4 ...
#> .. ..$ Lower : num [1:100] 16.2 16.2 16.2 16.2 16.2 ...
#> .. ..$ Upper : num [1:100] 16.6 16.6 16.6 16.6 16.6 ...
#> ..$ : tibble [100 × 4] (S3: tbl_df/tbl/data.frame)
#> .. ..$ dose : num [1:100] 5000 4588 4210 3863 3544 ...
#> .. ..$ Prediction: num [1:100] 16.9 17 17 17 17 ...
#> .. ..$ Lower : num [1:100] 16.9 16.9 16.9 16.9 16.9 ...
#> .. ..$ Upper : num [1:100] 17 17 17 17 17.1 ...
#> ..$ : tibble [100 × 4] (S3: tbl_df/tbl/data.frame)
#> .. ..$ dose : num [1:100] 5000 4588 4210 3863 3544 ...
#> .. ..$ Prediction: num [1:100] 14.5 14.5 14.5 14.5 14.5 ...
#> .. ..$ Lower : num [1:100] 14.3 14.3 14.3 14.3 14.3 ...
#> .. ..$ Upper : num [1:100] 14.8 14.8 14.8 14.8 14.8 ...
#> ..$ : tibble [100 × 4] (S3: tbl_df/tbl/data.frame)
#> .. ..$ dose : num [1:100] 5000 4588 4210 3863 3544 ...
#> .. ..$ Prediction: num [1:100] 16.6 16.6 16.6 16.6 16.6 ...
#> .. ..$ Lower : num [1:100] 16.4 16.4 16.4 16.4 16.4 ...
#> .. ..$ Upper : num [1:100] 16.8 16.8 16.8 16.8 16.8 ...
#> ..$ : tibble [100 × 4] (S3: tbl_df/tbl/data.frame)
#> .. ..$ dose : num [1:100] 5000 4588 4210 3863 3544 ...
#> .. ..$ Prediction: num [1:100] 19.9 19.9 19.9 19.9 19.9 ...
#> .. ..$ Lower : num [1:100] 19.8 19.8 19.8 19.8 19.8 ...
#> .. ..$ Upper : num [1:100] 19.9 19.9 19.9 19.9 19.9 ...
#> ..$ : tibble [100 × 4] (S3: tbl_df/tbl/data.frame)
#> .. ..$ dose : num [1:100] 5000 4588 4210 3863 3544 ...
#> .. ..$ Prediction: num [1:100] 16.6 16.6 16.6 16.6 16.6 ...
#> .. ..$ Lower : num [1:100] 16.4 16.4 16.4 16.4 16.4 ...
#> .. ..$ Upper : num [1:100] 16.8 16.8 16.8 16.8 16.7 ...
#> ..$ : tibble [100 × 4] (S3: tbl_df/tbl/data.frame)
#> .. ..$ dose : num [1:100] 5000 4588 4210 3863 3544 ...
#> .. ..$ Prediction: num [1:100] 16.5 16.5 16.5 16.5 16.5 ...
#> .. ..$ Lower : num [1:100] NA NA NA NA NA NA NA NA NA NA ...
#> .. ..$ Upper : num [1:100] NA NA NA NA NA NA NA NA NA NA ...
#> ..$ : tibble [100 × 4] (S3: tbl_df/tbl/data.frame)
#> .. ..$ dose : num [1:100] 5000 4588 4210 3863 3544 ...
#> .. ..$ Prediction: num [1:100] 17.9 17.9 17.9 17.9 17.9 ...
#> .. ..$ Lower : num [1:100] 17.6 17.6 17.6 17.6 17.6 ...
#> .. ..$ Upper : num [1:100] 18.1 18.1 18.1 18.1 18.1 ...
#> ..$ : tibble [100 × 4] (S3: tbl_df/tbl/data.frame)
#> .. ..$ dose : num [1:100] 5000 4588 4210 3863 3544 ...
#> .. ..$ Prediction: num [1:100] 16.5 16.5 16.5 16.5 16.5 ...
#> .. ..$ Lower : num [1:100] 16.2 16.2 16.2 16.2 16.2 ...
#> .. ..$ Upper : num [1:100] 16.8 16.8 16.8 16.7 16.7 ...
#> ..$ : tibble [100 × 4] (S3: tbl_df/tbl/data.frame)
#> .. ..$ dose : num [1:100] 5000 4588 4210 3863 3544 ...
#> .. ..$ Prediction: num [1:100] 16 16 16 16 16 ...
#> .. ..$ Lower : num [1:100] NaN NaN NaN NaN NaN NaN NaN NaN NaN NaN ...
#> .. ..$ Upper : num [1:100] NaN NaN NaN NaN NaN NaN NaN NaN NaN NaN ...
#> ..$ : tibble [100 × 4] (S3: tbl_df/tbl/data.frame)
#> .. ..$ dose : num [1:100] 5000 4588 4210 3863 3544 ...
#> .. ..$ Prediction: num [1:100] 15 15 15 15 15 ...
#> .. ..$ Lower : num [1:100] NA NA NA NA NA NA NA NA NA NA ...
#> .. ..$ Upper : num [1:100] NA NA NA NA NA NA NA NA NA NA ...
#> ..$ : tibble [100 × 4] (S3: tbl_df/tbl/data.frame)
#> .. ..$ dose : num [1:100] 5000 4588 4210 3863 3544 ...
#> .. ..$ Prediction: num [1:100] 18.4 18.4 18.4 18.4 18.4 ...
#> .. ..$ Lower : num [1:100] 18.4 18.4 18.4 18.4 18.4 ...
#> .. ..$ Upper : num [1:100] 18.5 18.5 18.5 18.5 18.5 ...
#> ..$ : tibble [100 × 4] (S3: tbl_df/tbl/data.frame)
#> .. ..$ dose : num [1:100] 5000 4588 4210 3863 3544 ...
#> .. ..$ Prediction: num [1:100] 15.6 15.6 15.6 15.6 15.6 ...
#> .. ..$ Lower : num [1:100] 15.4 15.4 15.4 15.4 15.4 ...
#> .. ..$ Upper : num [1:100] 15.7 15.7 15.7 15.7 15.7 ...
#> ..$ : tibble [100 × 4] (S3: tbl_df/tbl/data.frame)
#> .. ..$ dose : num [1:100] 5000 4588 4210 3863 3544 ...
#> .. ..$ Prediction: num [1:100] 14.6 14.6 14.6 14.6 14.6 ...
#> .. ..$ Lower : num [1:100] 14.3 14.3 14.3 14.3 14.3 ...
#> .. ..$ Upper : num [1:100] 14.9 14.9 14.9 14.9 14.9 ...
#> ..$ : tibble [100 × 4] (S3: tbl_df/tbl/data.frame)
#> .. ..$ dose : num [1:100] 5000 4588 4210 3863 3544 ...
#> .. ..$ Prediction: num [1:100] 16.2 16.2 16.2 16.2 16.2 ...
#> .. ..$ Lower : num [1:100] 16 16 16 16 16 ...
#> .. ..$ Upper : num [1:100] 16.5 16.5 16.5 16.4 16.4 ...
#> ..$ : tibble [100 × 4] (S3: tbl_df/tbl/data.frame)
#> .. ..$ dose : num [1:100] 5000 4588 4210 3863 3544 ...
#> .. ..$ Prediction: num [1:100] 17.5 17.5 17.5 17.5 17.5 ...
#> .. ..$ Lower : num [1:100] 17.4 17.4 17.4 17.4 17.4 ...
#> .. ..$ Upper : num [1:100] 17.7 17.7 17.7 17.7 17.7 ...
#> ..$ : tibble [100 × 4] (S3: tbl_df/tbl/data.frame)
#> .. ..$ dose : num [1:100] 5000 4588 4210 3863 3544 ...
#> .. ..$ Prediction: num [1:100] 17.3 17.3 17.3 17.3 17.3 ...
#> .. ..$ Lower : num [1:100] NA NA NA NA NA NA NA NA NA NA ...
#> .. ..$ Upper : num [1:100] NA NA NA NA NA NA NA NA NA NA ...
#> ..$ : tibble [100 × 4] (S3: tbl_df/tbl/data.frame)
#> .. ..$ dose : num [1:100] 5000 4588 4210 3863 3544 ...
#> .. ..$ Prediction: num [1:100] 17.5 17.5 17.5 17.5 17.5 ...
#> .. ..$ Lower : num [1:100] 17.4 17.4 17.4 17.4 17.4 ...
#> .. ..$ Upper : num [1:100] 17.6 17.6 17.6 17.6 17.6 ...
#> ..$ : tibble [100 × 4] (S3: tbl_df/tbl/data.frame)
#> .. ..$ dose : num [1:100] 5000 4588 4210 3863 3544 ...
#> .. ..$ Prediction: num [1:100] 14.5 14.5 14.5 14.5 14.5 ...
#> .. ..$ Lower : num [1:100] 14.4 14.4 14.4 14.4 14.4 ...
#> .. ..$ Upper : num [1:100] 14.6 14.6 14.6 14.6 14.6 ...
#> ..$ : tibble [100 × 4] (S3: tbl_df/tbl/data.frame)
#> .. ..$ dose : num [1:100] 5000 4588 4210 3863 3544 ...
#> .. ..$ Prediction: num [1:100] 15.1 15.1 15.1 15.1 15.1 ...
#> .. ..$ Lower : num [1:100] NaN NaN NaN NaN NaN NaN NaN NaN NaN NaN ...
#> .. ..$ Upper : num [1:100] NaN NaN NaN NaN NaN NaN NaN NaN NaN NaN ...
#> ..$ : tibble [100 × 4] (S3: tbl_df/tbl/data.frame)
#> .. ..$ dose : num [1:100] 5000 4588 4210 3863 3544 ...
#> .. ..$ Prediction: num [1:100] 15.6 15.6 15.6 15.6 15.6 ...
#> .. ..$ Lower : num [1:100] NA NA NA NA NA NA NA NA NA NA ...
#> .. ..$ Upper : num [1:100] NA NA NA NA NA NA NA NA NA NA ...
#> ..$ : tibble [100 × 4] (S3: tbl_df/tbl/data.frame)
#> .. ..$ dose : num [1:100] 5000 4588 4210 3863 3544 ...
#> .. ..$ Prediction: num [1:100] 15.2 15.2 15.2 15.2 15.2 ...
#> .. ..$ Lower : num [1:100] 14.9 14.9 14.9 14.9 14.9 ...
#> .. ..$ Upper : num [1:100] 15.5 15.5 15.5 15.5 15.5 ...
#> ..$ : tibble [100 × 4] (S3: tbl_df/tbl/data.frame)
#> .. ..$ dose : num [1:100] 5000 4588 4210 3863 3544 ...
#> .. ..$ Prediction: num [1:100] 17 17 17 17 17 ...
#> .. ..$ Lower : num [1:100] NA NA NA NA NA NA NA NA NA NA ...
#> .. ..$ Upper : num [1:100] NA NA NA NA NA NA NA NA NA NA ...
#> ..$ : tibble [100 × 4] (S3: tbl_df/tbl/data.frame)
#> .. ..$ dose : num [1:100] 5000 4588 4210 3863 3544 ...
#> .. ..$ Prediction: num [1:100] 15.8 15.8 15.8 15.8 15.8 ...
#> .. ..$ Lower : num [1:100] 15.5 15.5 15.5 15.5 15.5 ...
#> .. ..$ Upper : num [1:100] 16.1 16.1 16.1 16 16 ...
#> ..$ : tibble [100 × 4] (S3: tbl_df/tbl/data.frame)
#> .. ..$ dose : num [1:100] 5000 4588 4210 3863 3544 ...
#> .. ..$ Prediction: num [1:100] 15.3 15.3 15.3 15.3 15.3 ...
#> .. ..$ Lower : num [1:100] 15.3 15.3 15.3 15.3 15.3 ...
#> .. ..$ Upper : num [1:100] 15.4 15.4 15.4 15.4 15.4 ...
#> ..$ : tibble [100 × 4] (S3: tbl_df/tbl/data.frame)
#> .. ..$ dose : num [1:100] 5000 4588 4210 3863 3544 ...
#> .. ..$ Prediction: num [1:100] 18 18 18 18 18 ...
#> .. ..$ Lower : num [1:100] 17.9 17.9 17.9 17.9 17.9 ...
#> .. ..$ Upper : num [1:100] 18.2 18.2 18.2 18.2 18.2 ...
#> ..$ : tibble [100 × 4] (S3: tbl_df/tbl/data.frame)
#> .. ..$ dose : num [1:100] 5000 4588 4210 3863 3544 ...
#> .. ..$ Prediction: num [1:100] 17.2 17.2 17.2 17.2 17.2 ...
#> .. ..$ Lower : num [1:100] 17.1 17.1 17.1 17.1 17.1 ...
#> .. ..$ Upper : num [1:100] 17.3 17.3 17.3 17.3 17.3 ...
#> ..$ : tibble [100 × 4] (S3: tbl_df/tbl/data.frame)
#> .. ..$ dose : num [1:100] 5000 4588 4210 3863 3544 ...
#> .. ..$ Prediction: num [1:100] 15.8 15.8 15.8 15.8 15.8 ...
#> .. ..$ Lower : num [1:100] 15.8 15.8 15.8 15.8 15.8 ...
#> .. ..$ Upper : num [1:100] 15.9 15.9 15.9 15.9 15.9 ...
#> ..$ : tibble [1 × 4] (S3: tbl_df/tbl/data.frame)
#> .. ..$ dose : num NA
#> .. ..$ Prediction: num NA
#> .. ..$ Lower : num NA
#> .. ..$ Upper : num NA
#> ..$ : tibble [1 × 4] (S3: tbl_df/tbl/data.frame)
#> .. ..$ dose : num NA
#> .. ..$ Prediction: num NA
#> .. ..$ Lower : num NA
#> .. ..$ Upper : num NA
#> ..$ : tibble [1 × 4] (S3: tbl_df/tbl/data.frame)
#> .. ..$ dose : num NA
#> .. ..$ Prediction: num NA
#> .. ..$ Lower : num NA
#> .. ..$ Upper : num NA
#> ..$ : tibble [1 × 4] (S3: tbl_df/tbl/data.frame)
#> .. ..$ dose : num NA
#> .. ..$ Prediction: num NA
#> .. ..$ Lower : num NA
#> .. ..$ Upper : num NA
#> ..$ : tibble [1 × 4] (S3: tbl_df/tbl/data.frame)
#> .. ..$ dose : num NA
#> .. ..$ Prediction: num NA
#> .. ..$ Lower : num NA
#> .. ..$ Upper : num NA
#> ..$ : tibble [1 × 4] (S3: tbl_df/tbl/data.frame)
#> .. ..$ dose : num NA
#> .. ..$ Prediction: num NA
#> .. ..$ Lower : num NA
#> .. ..$ Upper : num NA
#> $ plot_points :List of 45
#> ..$ : tibble [24 × 2] (S3: tbl_df/tbl/data.frame)
#> .. ..$ peptide_intensity_missing: num [1:24] 19.2 18.9 19.1 19 18.7 ...
#> .. ..$ concentration : num [1:24] 0 50 50 50 100 100 100 500 500 500 ...
#> ..$ : tibble [16 × 2] (S3: tbl_df/tbl/data.frame)
#> .. ..$ peptide_intensity_missing: num [1:16] 16.3 16 16 16.2 15.3 ...
#> .. ..$ concentration : num [1:16] 0 50 50 50 100 100 100 0 5000 0 ...
#> ..$ : tibble [24 × 2] (S3: tbl_df/tbl/data.frame)
#> .. ..$ peptide_intensity_missing: num [1:24] 17.2 16.8 16.9 16.9 16.6 ...
#> .. ..$ concentration : num [1:24] 0 50 50 50 100 100 100 500 500 500 ...
#> ..$ : tibble [24 × 2] (S3: tbl_df/tbl/data.frame)
#> .. ..$ peptide_intensity_missing: num [1:24] 19.2 19.2 19.2 19.2 18.9 ...
#> .. ..$ concentration : num [1:24] 0 50 50 50 100 100 100 500 500 500 ...
#> ..$ : tibble [23 × 2] (S3: tbl_df/tbl/data.frame)
#> .. ..$ peptide_intensity_missing: num [1:23] 17.7 17.1 17.2 17.4 17.4 ...
#> .. ..$ concentration : num [1:23] 0 50 50 100 100 100 500 500 500 1000 ...
#> ..$ : tibble [17 × 2] (S3: tbl_df/tbl/data.frame)
#> .. ..$ peptide_intensity_missing: num [1:17] 15.3 15.2 15.1 14.8 14.8 ...
#> .. ..$ concentration : num [1:17] 0 50 50 100 100 100 500 1000 1000 1000 ...
#> ..$ : tibble [19 × 2] (S3: tbl_df/tbl/data.frame)
#> .. ..$ peptide_intensity_missing: num [1:19] 15.4 14.9 14.8 14.9 14.9 ...
#> .. ..$ concentration : num [1:19] 0 50 50 100 500 500 500 1000 1000 1000 ...
#> ..$ : tibble [22 × 2] (S3: tbl_df/tbl/data.frame)
#> .. ..$ peptide_intensity_missing: num [1:22] 16.1 15.5 15.8 15.7 15.3 ...
#> .. ..$ concentration : num [1:22] 0 50 50 50 100 100 100 500 500 500 ...
#> ..$ : tibble [22 × 2] (S3: tbl_df/tbl/data.frame)
#> .. ..$ peptide_intensity_missing: num [1:22] 16.2 16.1 15.9 16.2 16.2 ...
#> .. ..$ concentration : num [1:22] 0 50 50 50 100 100 100 500 500 0 ...
#> ..$ : tibble [23 × 2] (S3: tbl_df/tbl/data.frame)
#> .. ..$ peptide_intensity_missing: num [1:23] 16.5 16.8 16.2 16.8 16.2 ...
#> .. ..$ concentration : num [1:23] 50 50 50 100 100 100 500 500 500 1000 ...
#> ..$ : tibble [23 × 2] (S3: tbl_df/tbl/data.frame)
#> .. ..$ peptide_intensity_missing: num [1:23] 17.6 17.4 17.3 17.5 17.6 ...
#> .. ..$ concentration : num [1:23] 0 50 50 50 100 100 500 500 500 1000 ...
#> ..$ : tibble [24 × 2] (S3: tbl_df/tbl/data.frame)
#> .. ..$ peptide_intensity_missing: num [1:24] 16.3 16.8 16.8 17 16.5 ...
#> .. ..$ concentration : num [1:24] 0 50 50 50 100 100 100 500 500 500 ...
#> ..$ : tibble [23 × 2] (S3: tbl_df/tbl/data.frame)
#> .. ..$ peptide_intensity_missing: num [1:23] 17.5 17.1 17.3 17.1 17.2 ...
#> .. ..$ concentration : num [1:23] 0 50 50 50 100 100 100 500 500 500 ...
#> ..$ : tibble [17 × 2] (S3: tbl_df/tbl/data.frame)
#> .. ..$ peptide_intensity_missing: num [1:17] 14.7 14.9 14.5 14.4 15 ...
#> .. ..$ concentration : num [1:17] 50 50 50 100 100 500 500 500 1000 0 ...
#> ..$ : tibble [24 × 2] (S3: tbl_df/tbl/data.frame)
#> .. ..$ peptide_intensity_missing: num [1:24] 16.5 16.3 16.2 17 17 ...
#> .. ..$ concentration : num [1:24] 0 50 50 50 100 100 100 500 500 500 ...
#> ..$ : tibble [24 × 2] (S3: tbl_df/tbl/data.frame)
#> .. ..$ peptide_intensity_missing: num [1:24] 20 19.9 19.8 20 20 ...
#> .. ..$ concentration : num [1:24] 0 50 50 50 100 100 100 500 500 500 ...
#> ..$ : tibble [24 × 2] (S3: tbl_df/tbl/data.frame)
#> .. ..$ peptide_intensity_missing: num [1:24] 16.3 16.7 16 16.6 16.7 ...
#> .. ..$ concentration : num [1:24] 0 50 50 50 100 100 100 500 500 500 ...
#> ..$ : tibble [22 × 2] (S3: tbl_df/tbl/data.frame)
#> .. ..$ peptide_intensity_missing: num [1:22] 15.9 16.4 17.1 16.2 16.5 ...
#> .. ..$ concentration : num [1:22] 0 50 50 100 100 100 500 500 1000 0 ...
#> ..$ : tibble [24 × 2] (S3: tbl_df/tbl/data.frame)
#> .. ..$ peptide_intensity_missing: num [1:24] 17.7 17.9 18.1 18 18.1 ...
#> .. ..$ concentration : num [1:24] 0 50 50 50 100 100 100 500 500 500 ...
#> ..$ : tibble [23 × 2] (S3: tbl_df/tbl/data.frame)
#> .. ..$ peptide_intensity_missing: num [1:23] 16.1 16.3 16.1 16.7 15.9 ...
#> .. ..$ concentration : num [1:23] 0 50 50 50 100 100 100 500 500 500 ...
#> ..$ : tibble [22 × 2] (S3: tbl_df/tbl/data.frame)
#> .. ..$ peptide_intensity_missing: num [1:22] 16 15.6 15.7 16.3 15.4 ...
#> .. ..$ concentration : num [1:22] 0 50 50 50 100 100 500 500 500 1000 ...
#> ..$ : tibble [21 × 2] (S3: tbl_df/tbl/data.frame)
#> .. ..$ peptide_intensity_missing: num [1:21] 14.9 15.5 15 15.3 15 ...
#> .. ..$ concentration : num [1:21] 50 50 50 100 100 100 500 500 1000 0 ...
#> ..$ : tibble [24 × 2] (S3: tbl_df/tbl/data.frame)
#> .. ..$ peptide_intensity_missing: num [1:24] 18.6 18.3 18.6 18.6 18.5 ...
#> .. ..$ concentration : num [1:24] 0 50 50 50 100 100 100 500 500 500 ...
#> ..$ : tibble [23 × 2] (S3: tbl_df/tbl/data.frame)
#> .. ..$ peptide_intensity_missing: num [1:23] 15.6 15.8 15.6 15.3 15.1 ...
#> .. ..$ concentration : num [1:23] 0 50 50 50 100 100 100 500 500 1000 ...
#> ..$ : tibble [18 × 2] (S3: tbl_df/tbl/data.frame)
#> .. ..$ peptide_intensity_missing: num [1:18] 14.6 14.6 14.6 14.4 14.3 ...
#> .. ..$ concentration : num [1:18] 50 50 100 100 500 500 1000 0 1000 1000 ...
#> ..$ : tibble [21 × 2] (S3: tbl_df/tbl/data.frame)
#> .. ..$ peptide_intensity_missing: num [1:21] 16 16.6 16.5 16.5 16.2 ...
#> .. ..$ concentration : num [1:21] 0 50 50 50 100 100 500 500 500 1000 ...
#> ..$ : tibble [24 × 2] (S3: tbl_df/tbl/data.frame)
#> .. ..$ peptide_intensity_missing: num [1:24] 17.7 17.6 17.3 17.4 17.1 ...
#> .. ..$ concentration : num [1:24] 0 50 50 50 100 100 100 500 500 500 ...
#> ..$ : tibble [24 × 2] (S3: tbl_df/tbl/data.frame)
#> .. ..$ peptide_intensity_missing: num [1:24] 17.5 17.3 17.5 17.3 17.2 ...
#> .. ..$ concentration : num [1:24] 0 50 50 50 100 100 100 500 500 500 ...
#> ..$ : tibble [24 × 2] (S3: tbl_df/tbl/data.frame)
#> .. ..$ peptide_intensity_missing: num [1:24] 17.5 17.2 17.4 17.4 17.3 ...
#> .. ..$ concentration : num [1:24] 0 50 50 50 100 100 100 500 500 500 ...
#> ..$ : tibble [13 × 2] (S3: tbl_df/tbl/data.frame)
#> .. ..$ peptide_intensity_missing: num [1:13] 14.7 14.7 14.4 14.4 14.4 ...
#> .. ..$ concentration : num [1:13] 0 100 500 1000 1000 5000 5000 5000 0 1 ...
#> ..$ : tibble [23 × 2] (S3: tbl_df/tbl/data.frame)
#> .. ..$ peptide_intensity_missing: num [1:23] 15.6 15.4 15.4 15.3 15.3 ...
#> .. ..$ concentration : num [1:23] 0 50 50 50 100 100 100 500 500 500 ...
#> ..$ : tibble [24 × 2] (S3: tbl_df/tbl/data.frame)
#> .. ..$ peptide_intensity_missing: num [1:24] 15.9 15.8 15.8 15.3 15.7 ...
#> .. ..$ concentration : num [1:24] 0 50 50 50 100 100 100 500 500 500 ...
#> ..$ : tibble [18 × 2] (S3: tbl_df/tbl/data.frame)
#> .. ..$ peptide_intensity_missing: num [1:18] 15.5 15.6 14.9 15.7 15.1 ...
#> .. ..$ concentration : num [1:18] 0 50 50 50 100 100 500 500 500 5000 ...
#> ..$ : tibble [24 × 2] (S3: tbl_df/tbl/data.frame)
#> .. ..$ peptide_intensity_missing: num [1:24] 17.1 17 16.9 17 17 ...
#> .. ..$ concentration : num [1:24] 0 50 50 50 100 100 100 500 500 500 ...
#> ..$ : tibble [24 × 2] (S3: tbl_df/tbl/data.frame)
#> .. ..$ peptide_intensity_missing: num [1:24] 16 16.2 16.1 16 15.4 ...
#> .. ..$ concentration : num [1:24] 0 50 50 50 100 100 100 500 500 500 ...
#> ..$ : tibble [19 × 2] (S3: tbl_df/tbl/data.frame)
#> .. ..$ peptide_intensity_missing: num [1:19] 15.4 15.3 15.3 15.4 15.3 ...
#> .. ..$ concentration : num [1:19] 0 50 50 50 100 100 500 500 1000 0 ...
#> ..$ : tibble [24 × 2] (S3: tbl_df/tbl/data.frame)
#> .. ..$ peptide_intensity_missing: num [1:24] 18.2 17.3 17.3 18.2 17.8 ...
#> .. ..$ concentration : num [1:24] 0 50 50 50 100 100 100 500 500 500 ...
#> ..$ : tibble [24 × 2] (S3: tbl_df/tbl/data.frame)
#> .. ..$ peptide_intensity_missing: num [1:24] 17.3 17.2 17 17.4 17.1 ...
#> .. ..$ concentration : num [1:24] 0 50 50 50 100 100 100 500 500 500 ...
#> ..$ : tibble [23 × 2] (S3: tbl_df/tbl/data.frame)
#> .. ..$ peptide_intensity_missing: num [1:23] 15.9 15.9 15.9 15.7 15.8 ...
#> .. ..$ concentration : num [1:23] 0 50 50 100 100 100 500 500 500 1000 ...
#> ..$ : tibble [16 × 2] (S3: tbl_df/tbl/data.frame)
#> .. ..$ peptide_intensity_missing: num [1:16] 14.9 14.7 14.9 15 14.7 ...
#> .. ..$ concentration : num [1:16] 50 100 500 500 1000 0 1000 1000 5000 5000 ...
#> ..$ : tibble [24 × 2] (S3: tbl_df/tbl/data.frame)
#> .. ..$ peptide_intensity_missing: num [1:24] 17.1 17.5 16.6 17 16.8 ...
#> .. ..$ concentration : num [1:24] 0 50 50 50 100 100 100 500 500 500 ...
#> ..$ : tibble [16 × 2] (S3: tbl_df/tbl/data.frame)
#> .. ..$ peptide_intensity_missing: num [1:16] 13.8 15.2 14.2 14.8 14.5 ...
#> .. ..$ concentration : num [1:16] 0 50 50 50 100 100 500 500 1000 1000 ...
#> ..$ : tibble [22 × 2] (S3: tbl_df/tbl/data.frame)
#> .. ..$ peptide_intensity_missing: num [1:22] 15.6 15.3 15.9 15.7 15.3 ...
#> .. ..$ concentration : num [1:22] 0 50 50 50 100 100 100 500 500 500 ...
#> ..$ : tibble [24 × 2] (S3: tbl_df/tbl/data.frame)
#> .. ..$ peptide_intensity_missing: num [1:24] 15.7 15.7 15.8 16 15.6 ...
#> .. ..$ concentration : num [1:24] 0 50 50 50 100 100 100 500 500 500 ...
#> ..$ : tibble [2 × 2] (S3: tbl_df/tbl/data.frame)
#> .. ..$ peptide_intensity_missing: num [1:2] 12.7 12.4
#> .. ..$ concentration : num [1:2] 100 5000
#> $ enough_conditions: logi [1:45] TRUE TRUE TRUE TRUE TRUE TRUE ...
#> $ dose_MNAR : logi [1:45] FALSE TRUE FALSE FALSE FALSE FALSE ...
#> $ anova_pval : num [1:45] 3.67e-20 1.47e-05 1.97e-08 2.86e-07 3.84e-04 ...
#> $ anova_adj_pval : num [1:45] 1.61e-18 1.62e-04 4.33e-07 4.19e-06 3.38e-03 ...
#> $ anova_significant: logi [1:45] TRUE TRUE TRUE TRUE TRUE FALSE ...
#> $ passed_filter : logi [1:45] TRUE TRUE TRUE TRUE FALSE FALSE ...
#> $ score : num [1:45] 1 0.4664 0.3729 0.0586 NA ...
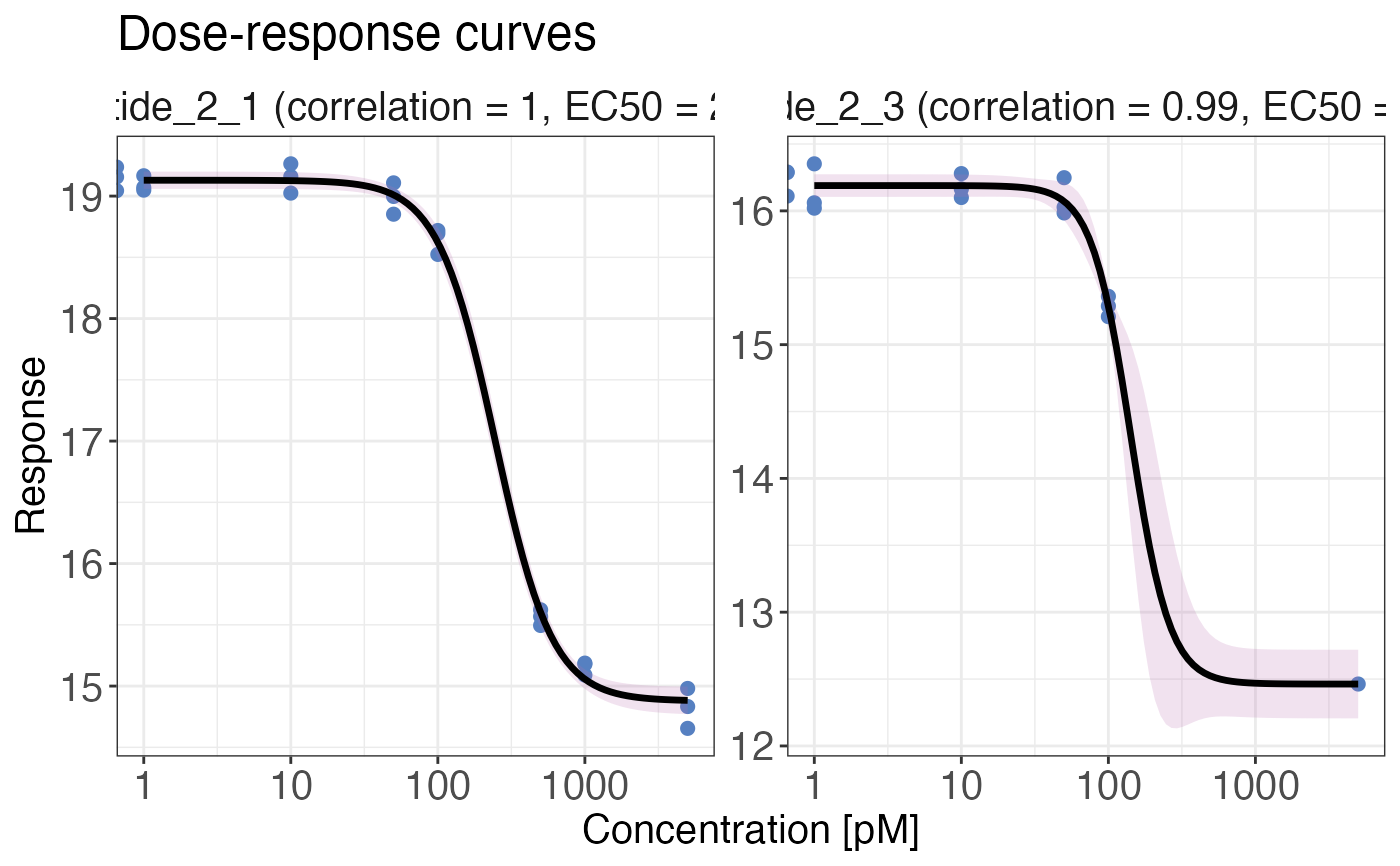
# Plot dose response curves
if (!is.null(drc_fit)) {
drc_4p_plot(
data = drc_fit,
grouping = peptide,
response = peptide_intensity_missing,
dose = concentration,
targets = c("peptide_2_1", "peptide_2_3"),
unit = "pM"
)
}
#> Warning: Using `size` aesthetic for lines was deprecated in ggplot2 3.4.0.
#> ℹ Please use `linewidth` instead.
#> ℹ The deprecated feature was likely used in the protti package.
#> Please report the issue at <https://github.com/jpquast/protti/issues>.
#> $`1`
#> Warning: log-10 transformation introduced infinite values.
 #>
# }
#>
# }