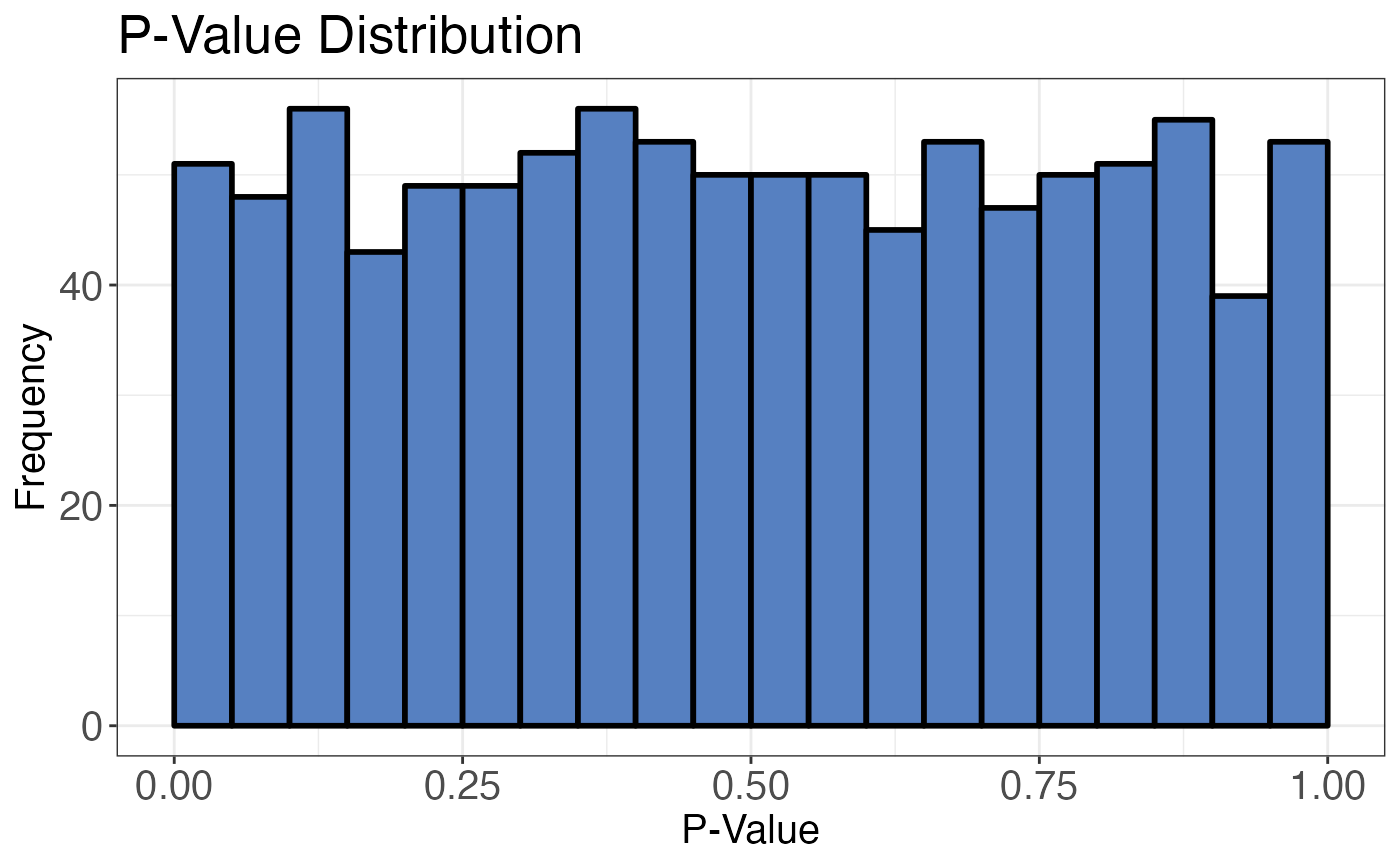
Plots the distribution of p-values derived from any statistical test as a histogram.
pval_distribution_plot(data, grouping, pval, facet_by = NULL)Arguments
- data
a data frame that contains at least grouping identifiers (precursor, peptide or protein) and p-values derived from any statistical test.
- grouping
a character column in the
datadata frame that contains either precursor, peptide or protein identifiers. For each entry in this column there should be one unique p-value. That means the statistical test that created the p-value should have been performed on the level of the content of this column.- pval
a numeric column in the
datadata frame that contains p-values.- facet_by
optional, a character column that contains information by which the data should be faceted into multiple plots.
Value
A histogram plot that shows the p-value distribution.
Examples
set.seed(123) # Makes example reproducible

# Create example data
data <- data.frame(
  peptide = paste0("peptide", 1:1000),
  pval = runif(n = 1000)
)

# Plot p-values
pval_distribution_plot(
  data = data,
  grouping = peptide,
  pval = pval
)
