Calculates the charge state distribution for each sample (by count or intensity).
qc_charge_states(
  data,
  sample,
  grouping,
  charge_states,
  intensity = NULL,
  remove_na_intensities = TRUE,
  method = "count",
  plot = FALSE,
  interactive = FALSE
)
Arguments
- data
a data frame that contains at least sample names, peptide or precursor identifiers and missed cleavage counts for each peptide or precursor.
- sample
a character or factor column in the
datadata frame that contains the sample name.- grouping
a character column in the
datadata frame that contains either precursor or peptide identifiers.- charge_states
a character or numeric column in the
datadata frame that contains the different charge states assigned to the precursor or peptide.- intensity
a numeric column in the
datadata frame that contains the corresponding raw or normalised intensity values (not log2) for each peptide or precursor. Required when "intensity" is chosen as the method.- remove_na_intensities
a logical value that specifies if sample/grouping combinations with intensities that are NA (not quantified IDs) should be dropped from the data frame for analysis of missed cleavages. Default is TRUE since we are usually interested in quantifiable peptides. This is only relevant for method = "count".
- method
a character value that indicates the method used for evaluation. "count" calculates the charge state distribution based on counts of the corresponding peptides or precursors in the charge state group, "intensity" calculates the percentage of precursors or peptides in each charge state group based on the corresponding intensity values.
- plot
a logical value that indicates whether the result should be plotted.
- interactive
a logical value that specifies whether the plot should be interactive (default is FALSE).
Value
A data frame that contains the calculated percentage made up by the sum of either all counts or intensities of peptides or precursors of the corresponding charge state (depending on which method is chosen).
Examples
# Load libraries
library(dplyr)
set.seed(123) # Makes example reproducible
# Create example data
data <- create_synthetic_data(
n_proteins = 100,
frac_change = 0.05,
n_replicates = 3,
n_conditions = 2,
method = "effect_random"
) %>%
mutate(intensity_non_log2 = 2^peptide_intensity_missing)
# Calculate charge percentages
qc_charge_states(
data = data,
sample = sample,
grouping = peptide,
charge_states = charge,
intensity = intensity_non_log2,
method = "intensity",
plot = FALSE
)
#> # A tibble: 30 × 3
#> sample charge charge_per
#> <fct> <fct> <dbl>
#> 1 sample_1 1 7.01
#> 2 sample_1 2 47.2
#> 3 sample_1 3 42.6
#> 4 sample_1 4 3.19
#> 5 sample_1 5 0.0358
#> 6 sample_2 1 8.64
#> 7 sample_2 2 48.1
#> 8 sample_2 3 39.9
#> 9 sample_2 4 3.33
#> 10 sample_2 5 0.0581
#> # ℹ 20 more rows
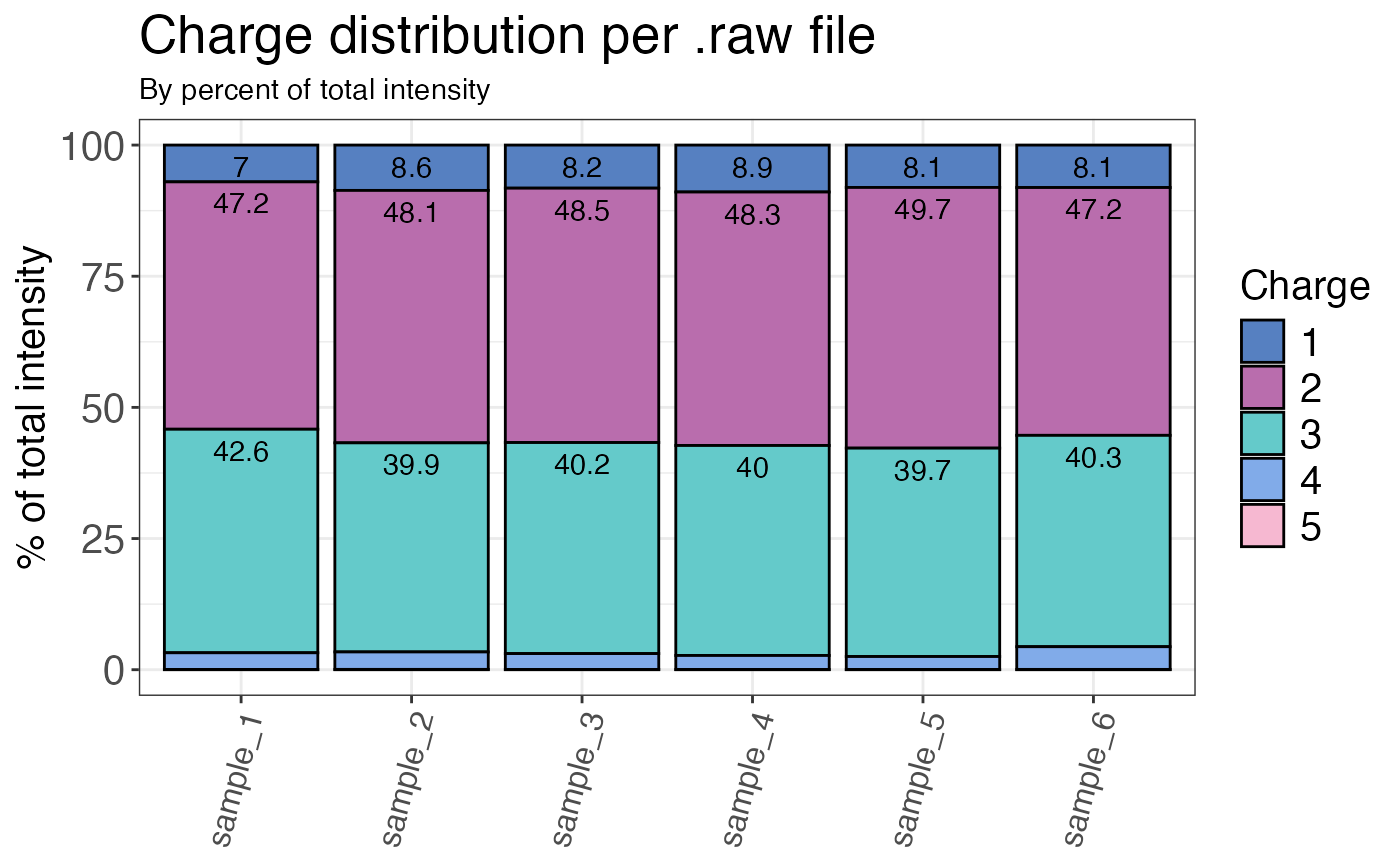
# Plot charge states
qc_charge_states(
data = data,
sample = sample,
grouping = peptide,
charge_states = charge,
intensity = intensity_non_log2,
method = "intensity",
plot = TRUE
)