Calculates the percentage of contaminating proteins as the share of total intensity.
qc_contaminants(
  data,
  sample,
  protein,
  is_contaminant,
  intensity,
  n_contaminants = 5,
  plot = TRUE,
  interactive = FALSE
)
Arguments
- data
a data frame that contains at least the input variables.
- sample
a character or factor column in the
datadata frame that contains the sample names.- protein
a character column in the
datadata frame that contains protein IDs or protein names.- is_contaminant
a logical column that indicates if the protein is a contaminant.
- intensity
a numeric column in the
datadata frame that contains the corresponding raw or normalised intensity values (not log2).- n_contaminants
a numeric value that indicates how many contaminants should be displayed individually. The rest is combined to a group called "other". The default is 5.
- plot
a logical value that indicates if a plot is returned. If FALSE a table is returned.
- interactive
a logical value that indicates if the plot is made interactive using the r package
plotly.
Value
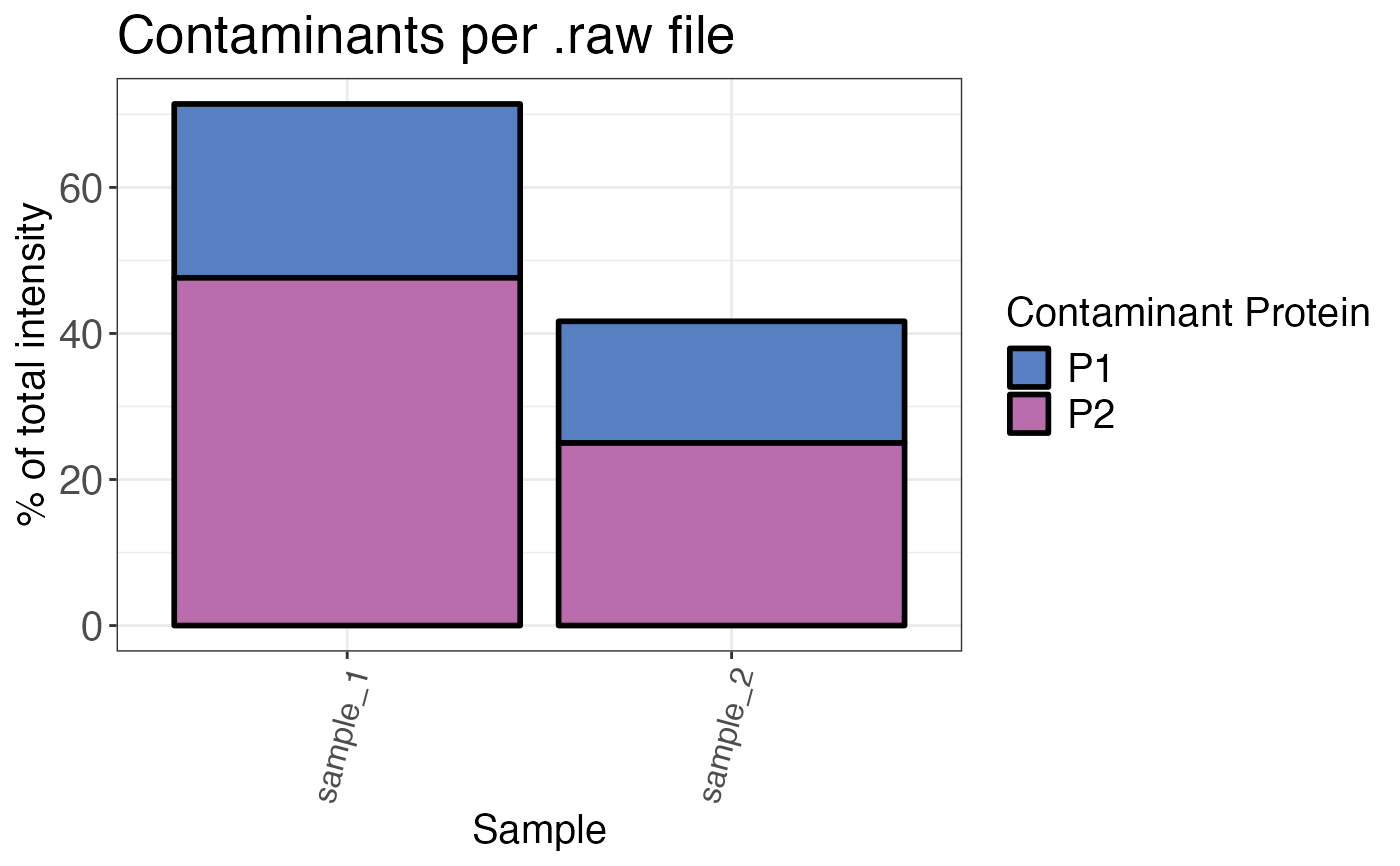
A bar plot that displays the percentage of contaminating proteins over all samples.
If plot = FALSE a data frame is returned.
Examples
data <- data.frame(
  sample = c(rep("sample_1", 10), rep("sample_2", 10)),
  leading_razor_protein = c(rep(c("P1", "P1", "P1", "P2", "P2", "P2", "P2", "P3", "P3", "P3"), 2)),
  potential_contaminant = c(rep(c(rep(TRUE, 7), rep(FALSE, 3)), 2)),
  intensity = c(rep(1, 2), rep(4, 4), rep(6, 4), rep(2, 3), rep(3, 5), rep(4, 2))
)

qc_contaminants(
  data,
  sample = sample,
  protein = leading_razor_protein,
  is_contaminant = potential_contaminant,
  intensity = intensity
)