Calculates and plots the coefficients of variation for the selected grouping.
qc_cvs(
  data,
  grouping,
  condition,
  intensity,
  plot = TRUE,
  plot_style = "density",
  max_cv = 200
)
Arguments
- data
a data frame containing at least peptide, precursor or protein identifiers, information on conditions and intensity values for each peptide, precursor or protein.
- grouping
a character column in the
datadata frame that contains the grouping variables (e.g. peptides, precursors or proteins).- condition
a character or factor column in the
datadata frame that contains condition information (e.g. "treated" and "control").- intensity
a numeric column in the
datadata frame that contains the corresponding raw or untransformed normalised intensity values for each peptide or precursor.- plot
a logical value that indicates whether the result should be plotted.
- plot_style
a character value that indicates the plotting style.
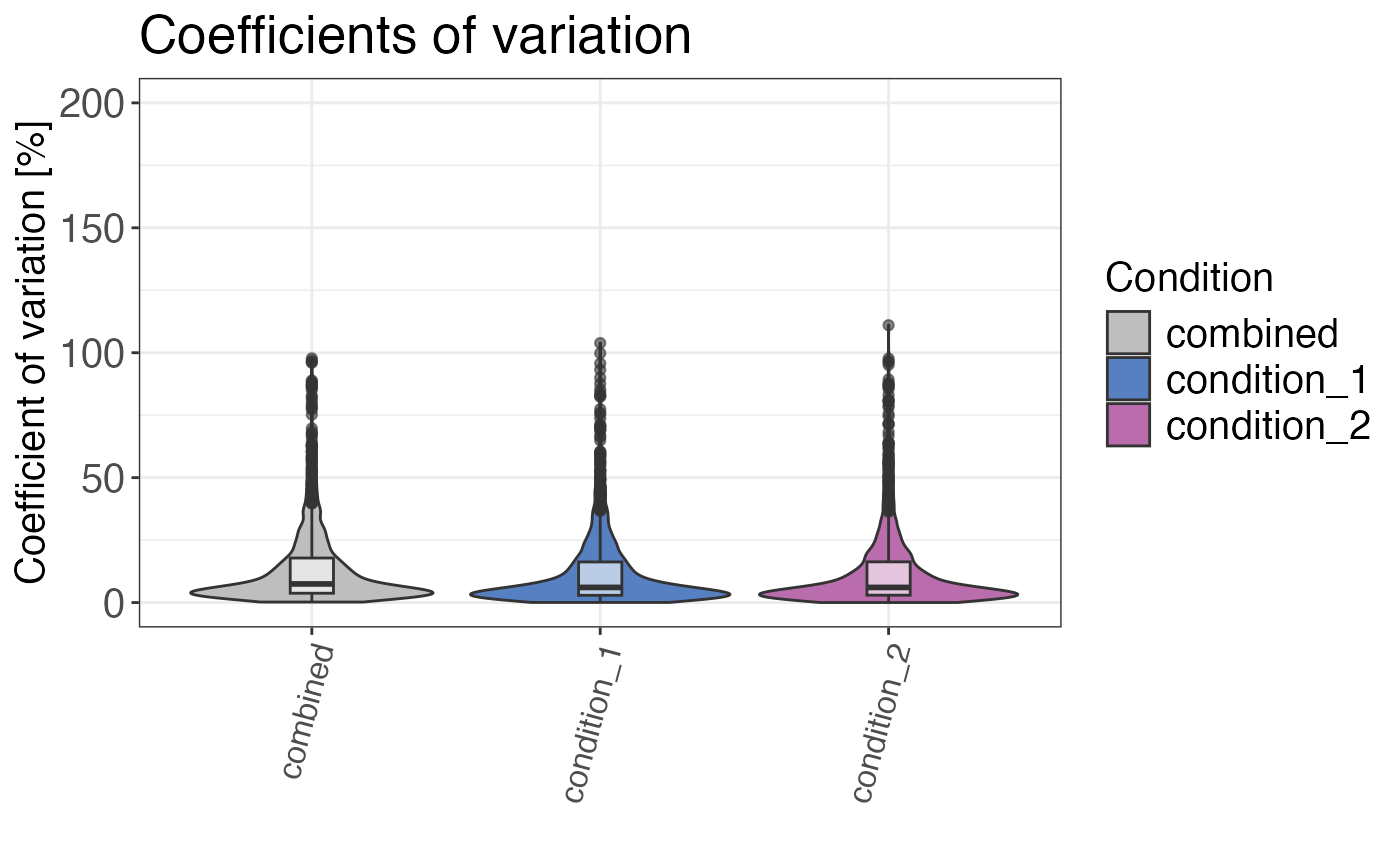
plot_style = "boxplot"plots a boxplot, whereasplot_style = "density"plots the CV density distribution.plot_style = "violin"returns a violin plot. Default isplot_style = "density".- max_cv
a numeric value that specifies the maximum percentage of CVs that should be included in the returned plot. The default value is
max_cv = 200.
Value
Either a data frame with the median CVs in % or a plot showing the distribution of the CVs is returned.
Examples
# Load libraries
library(dplyr)

set.seed(123) # Makes example reproducible

# Create example data
data <- create_synthetic_data(
  n_proteins = 100,
  frac_change = 0.05,
  n_replicates = 3,
  n_conditions = 2,
  method = "effect_random"
) %>%
  mutate(intensity_non_log2 = 2^peptide_intensity_missing)

# Calculate coefficients of variation
qc_cvs(
  data = data,
  grouping = peptide,
  condition = condition,
  intensity = intensity_non_log2,
  plot = FALSE
)
#> # A tibble: 2 × 3
#>   condition   median_cv median_cv_combined
#>   <chr>           <dbl>              <dbl>
#> 1 condition_2      6.06               7.49
#> 2 condition_1      6.07               7.49

# Plot coefficients of variation
# Different plot styles are available
qc_cvs(
  data = data,
  grouping = peptide,
  condition = condition,
  intensity = intensity_non_log2,
  plot = TRUE,
  plot_style = "violin"
)