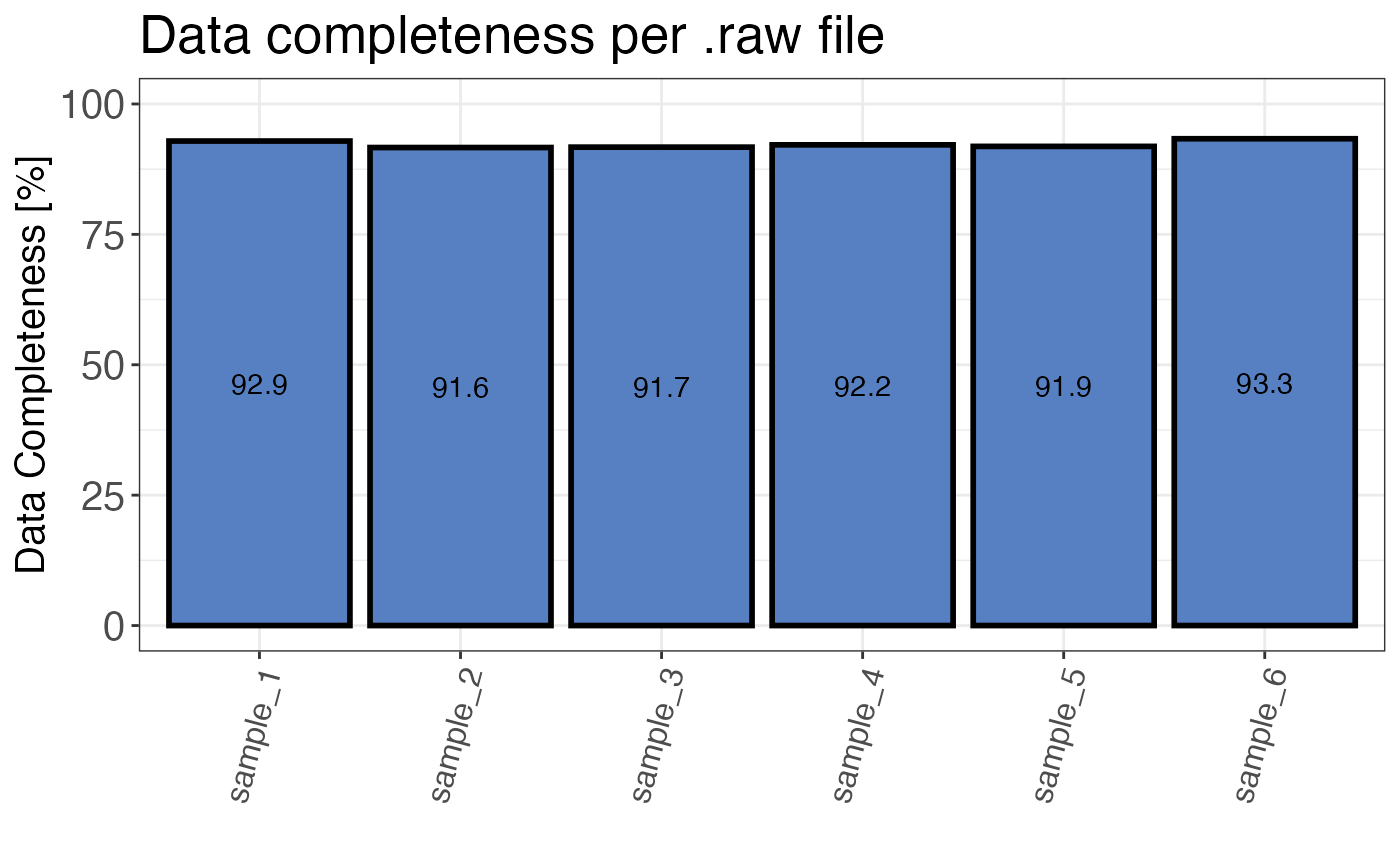
Calculates the percentage of data completeness. That means, what percentage of all detected precursors is present in each sample.
qc_data_completeness(
  data,
  sample,
  grouping,
  intensity,
  digestion = NULL,
  plot = TRUE,
  interactive = FALSE
)
Arguments
- data
a data frame containing at least the input variables.
- sample
a character or factor column in the
datadata frame that contains the sample names.- grouping
a character column in the
datadata frame that contains either precursor or peptide identifiers.- intensity
a numeric column in the
datadata frame that contains any intensity intensity values that missingness should be determined for.- digestion
optional, a character column in the
datadata frame that indicates the mode of digestion (limited proteolysis or tryptic digest). Alternatively, any other variable by which the data should be split can be provided.- plot
a logical value that indicates whether the result should be plotted.
- interactive
a logical value that specifies whether the plot should be interactive (default is FALSE).
Value
A bar plot that displays the percentage of data completeness over all samples.
If plot = FALSE a data frame is returned. If interactive = TRUE, the plot is
interactive.
Examples
set.seed(123) # Makes example reproducible

# Create example data
data <- create_synthetic_data(
  n_proteins = 100,
  frac_change = 0.05,
  n_replicates = 3,
  n_conditions = 2,
  method = "effect_random"
)

# Determine data completeness
qc_data_completeness(
  data = data,
  sample = sample,
  grouping = peptide,
  intensity = peptide_intensity_missing,
  plot = FALSE
)
#> # A tibble: 6 × 2
#>   sample   completeness
#>   <chr>           <dbl>
#> 1 sample_1         92.9
#> 2 sample_2         91.6
#> 3 sample_3         91.7
#> 4 sample_4         92.2
#> 5 sample_5         91.9
#> 6 sample_6         93.3

# Plot data completeness
qc_data_completeness(
  data = data,
  sample = sample,
  grouping = peptide,
  intensity = peptide_intensity_missing,
  plot = TRUE
)