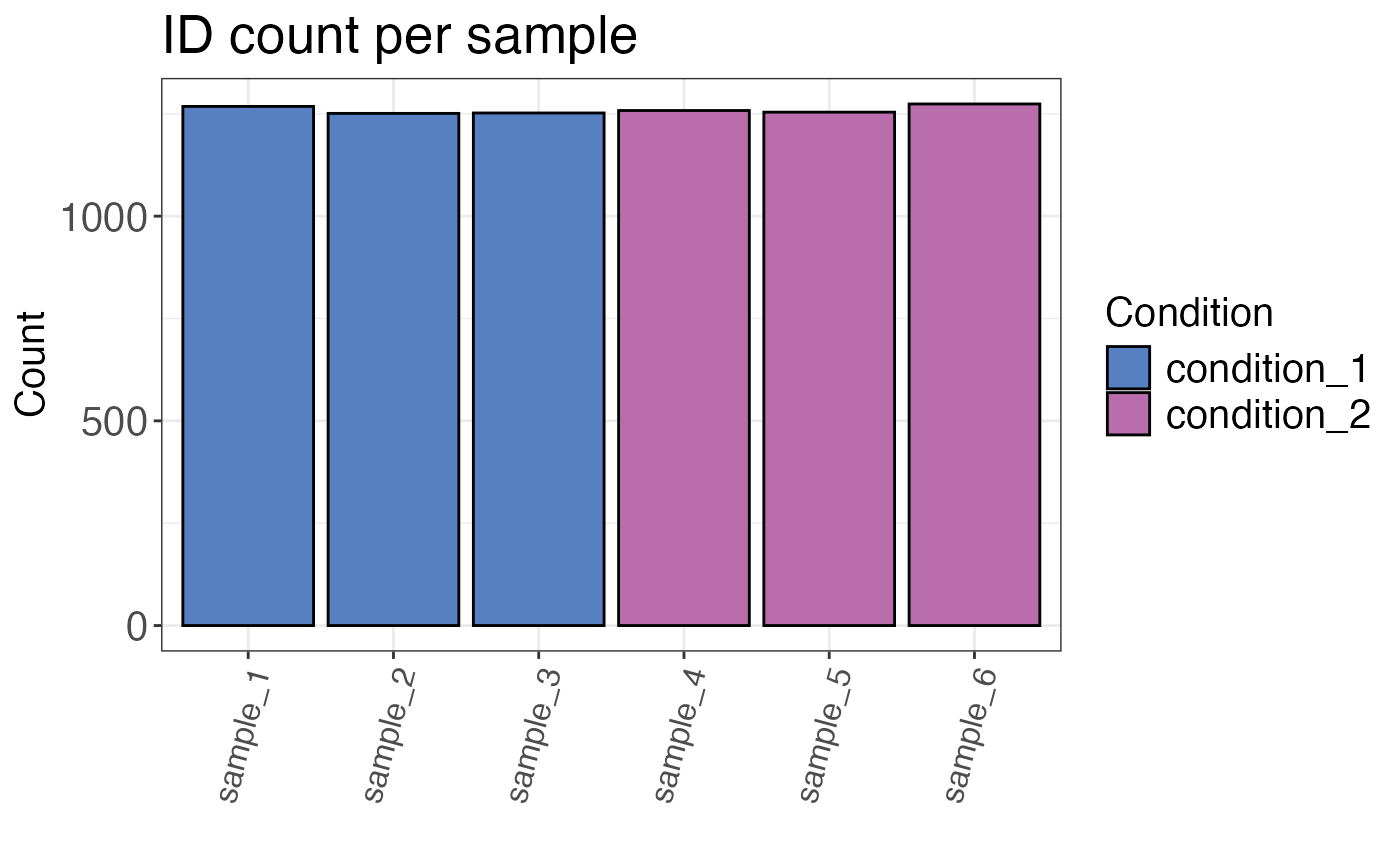
Returns a plot or table of the number of IDs for each sample. The default settings remove grouping variables without quantitative information (intensity is NA). These will not be counted as IDs.
qc_ids(
  data,
  sample,
  grouping,
  intensity,
  remove_na_intensities = TRUE,
  condition = NULL,
  title = "ID count per sample",
  plot = TRUE,
  interactive = FALSE
)
Arguments
- data
a data frame containing at least sample names and precursor/peptide/protein IDs.
- sample
a character or factor column in the
datadata frame that contains the sample name.- grouping
a character column in the
datadata frame that contains either precursor or peptide identifiers.- intensity
a character column in the
datadata frame that contains raw or log2 transformed intensities. Ifremove_na_intensities = FALSE, this argument is optional.- remove_na_intensities
a logical value that specifies if sample/grouping combinations with intensities that are NA (not quantified IDs) should be dropped from the data frame. Default is TRUE since we are usually interested in the number of quantifiable IDs.
- condition
optional, a column in the
datadata frame that contains condition information (e.g. "treated" and "control"). If this column is provided, the bars in the plot will be coloured according to the condition.- title
optional, a character value that specifies the plot title (default is "ID count per sample").
- plot
a logical value that indicates whether the result should be plotted.
- interactive
a logical value that specifies whether the plot should be interactive (default is FALSE).
Value
A bar plot with the height corresponding to the number of IDs, each bar represents one
sample (if plot = TRUE). If plot = FALSE a table with ID counts is returned.
Examples
set.seed(123) # Makes example reproducible

# Create example data
data <- create_synthetic_data(
  n_proteins = 100,
  frac_change = 0.05,
  n_replicates = 3,
  n_conditions = 2,
  method = "effect_random"
)

# Calculate number of identifications
qc_ids(
  data = data,
  sample = sample,
  grouping = peptide,
  intensity = peptide_intensity_missing,
  condition = condition,
  plot = FALSE
)
#> # A tibble: 6 × 3
#>   sample   condition   count
#>   <fct>    <chr>       <int>
#> 1 sample_3 condition_1  1252
#> 2 sample_4 condition_2  1258
#> 3 sample_5 condition_2  1254
#> 4 sample_6 condition_2  1274
#> 5 sample_2 condition_1  1251
#> 6 sample_1 condition_1  1268

# Plot number of identifications
qc_ids(
  data = data,
  sample = sample,
  grouping = peptide,
  intensity = peptide_intensity_missing,
  condition = condition,
  plot = TRUE
)