Check intensity distribution per sample and overall
Source:R/qc_intensity_distribution.R
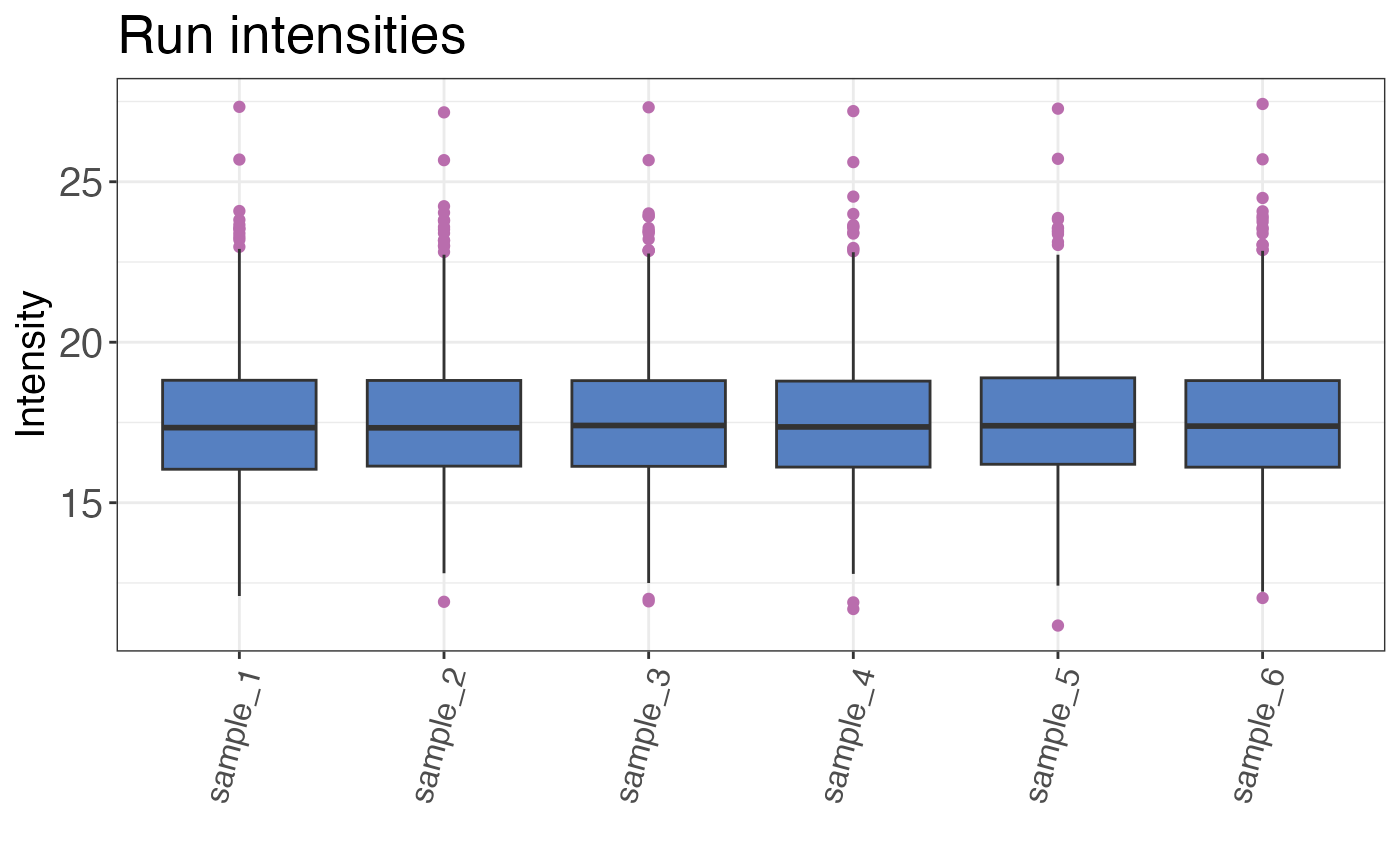
qc_intensity_distribution.RdPlots the overall or sample-wise distribution of all peptide intensities as a boxplot or histogram.
qc_intensity_distribution(
  data,
  sample = NULL,
  grouping,
  intensity_log2,
  plot_style
)
Arguments
- data
a data frame that contains at least sample names, grouping identifiers (precursor, peptide or protein) and log2 transformed intensities for each grouping identifier.
- sample
an optional character or factor column in the
datadata frame that contains the sample name. If the sample column is of type factor, the ordering is based on the factor levels. NOTE: If the overall distribution should be returned please do not provide the name of the sample column.- grouping
a character column in the
datadata frame that contains the grouping variables (e.g. peptides, precursors or proteins).- intensity_log2
a numeric column in the
datadata frame that contains the log2 transformed intensities of each grouping identifier sample combination.- plot_style
a character value that indicates the plot type. This can be either "histogram", "boxplot" or "violin". Plot style "boxplot" and "violin" can only be used if a sample column is provided.
Value
A histogram or boxplot that shows the intensity distribution over all samples or by sample.
Examples
set.seed(123) # Makes example reproducible

# Create example data
data <- create_synthetic_data(
  n_proteins = 100,
  frac_change = 0.05,
  n_replicates = 3,
  n_conditions = 2,
  method = "effect_random"
)

# Plot intensity distribution
# The plot style can be changed
qc_intensity_distribution(
  data = data,
  sample = sample,
  grouping = peptide,
  intensity_log2 = peptide_intensity_missing,
  plot_style = "boxplot"
)