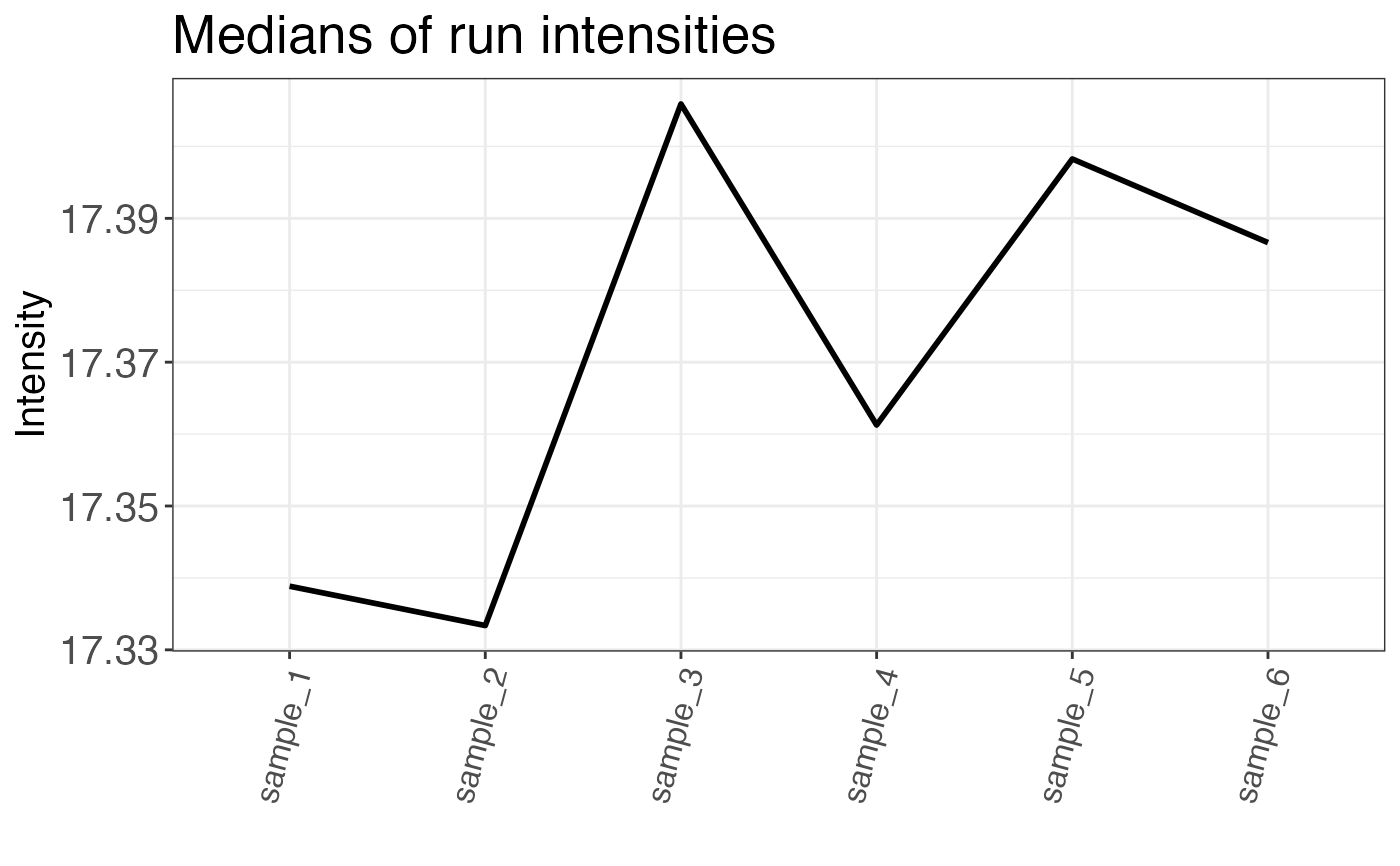
Median intensities per run are returned either as a plot or a table.
qc_median_intensities(
  data,
  sample,
  grouping,
  intensity,
  plot = TRUE,
  interactive = FALSE
)
Arguments
- data
a data frame that contains at least the input variables.
- sample
a character or factor column in the
datadata frame that contains the sample name.- grouping
a character column in the
datadata frame that contains either precursor or peptide identifiers.- intensity
a numeric column in the
datadata frame that contains intensity values. The intensity should be ideally log2 transformed, but also non-transformed values can be used.- plot
a logical value that indicates whether the result should be plotted.
- interactive
a logical value that specifies whether the plot should be interactive (default is FALSE).
Value
A plot that displays median intensity over all samples. If plot = FALSE a data
frame containing median intensities is returned.
Examples
set.seed(123) # Makes example reproducible

# Create example data
data <- create_synthetic_data(
  n_proteins = 100,
  frac_change = 0.05,
  n_replicates = 3,
  n_conditions = 2,
  method = "effect_random"
)

# Calculate median intensities
qc_median_intensities(
  data = data,
  sample = sample,
  grouping = peptide,
  intensity = peptide_intensity_missing,
  plot = FALSE
)
#> # A tibble: 6 × 2
#>   sample   median_intensity
#>   <chr>               <dbl>
#> 1 sample_1             17.3
#> 2 sample_2             17.3
#> 3 sample_3             17.4
#> 4 sample_4             17.4
#> 5 sample_5             17.4
#> 6 sample_6             17.4

# Plot median intensities
qc_median_intensities(
  data = data,
  sample = sample,
  grouping = peptide,
  intensity = peptide_intensity_missing,
  plot = TRUE
)
