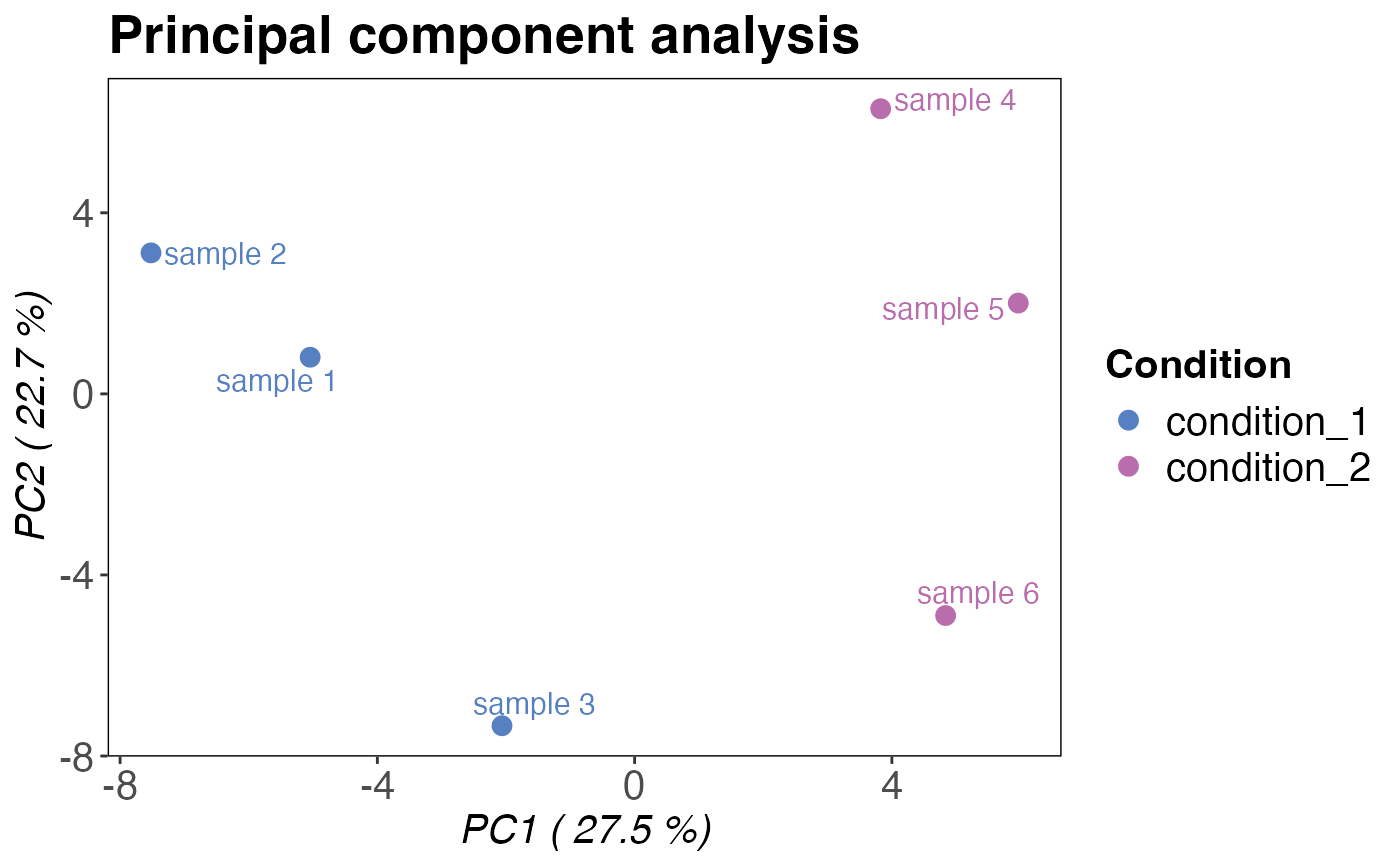
Plots a principal component analysis based on peptide or precursor intensities.
qc_pca(
  data,
  sample,
  grouping,
  intensity,
  condition,
  components = c("PC1", "PC2"),
  digestion = NULL,
  plot_style = "pca"
)
Arguments
- data
a data frame that contains sample names, peptide or precursor identifiers, corresponding intensities and a condition column indicating e.g. the treatment.
- sample
a character column in the
datadata frame that contains the sample name.- grouping
a character column in the
datadata frame that contains either precursor or peptide identifiers.- intensity
a numeric column in the
datadata frame that contains the corresponding intensity values for each peptide or precursor.- condition
a numeric or character column in the
datadata frame that contains condition information (e.g. "treated" and "control").- components
a character vector indicating the two components that should be displayed in the plot. By default these are PC1 and PC2. You can provide these using a character vector of the form c("PC1", "PC2").
- digestion
optional, a character column in the
datadata frame that indicates the mode of digestion (limited proteolysis or tryptic digest). Alternatively, any other variable by which the data should be split can be provided.- plot_style
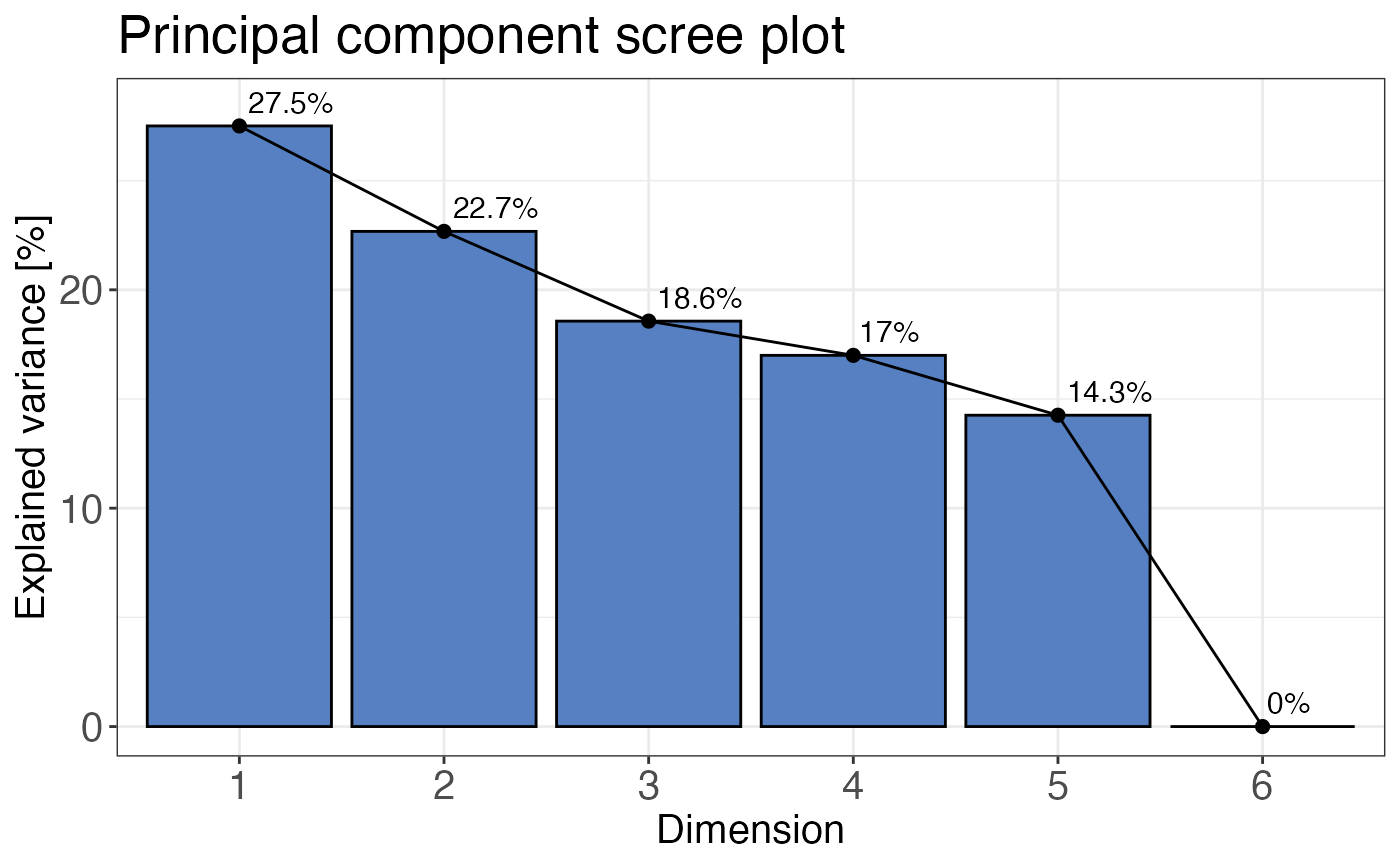
a character value that specifies what plot should be returned. If
plot_style = "pca"is selected the two PCA components supplied with thecomponentsargument are plottet against each other. This is the default.plot_style = "scree"returns a scree plot that displays the variance explained by each principal component in percent. The scree is useful for checking if any other than the default first two components should be plotted.
Value
A principal component analysis plot showing PC1 and PC2. If plot_style = "scree", a
scree plot for all dimensions is returned.
Examples
set.seed(123) # Makes example reproducible

# Create example data
data <- create_synthetic_data(
  n_proteins = 100,
  frac_change = 0.05,
  n_replicates = 3,
  n_conditions = 2,
)

# Plot scree plot
qc_pca(
  data = data,
  sample = sample,
  grouping = peptide,
  intensity = peptide_intensity_missing,
  condition = condition,
  plot_style = "scree"
)


# Plot principal components
qc_pca(
  data = data,
  sample = sample,
  grouping = peptide,
  intensity = peptide_intensity_missing,
  condition = condition
)
# Plot principal components
qc_pca(
data = data,
sample = sample,
grouping = peptide,
intensity = peptide_intensity_missing,
condition = condition
)