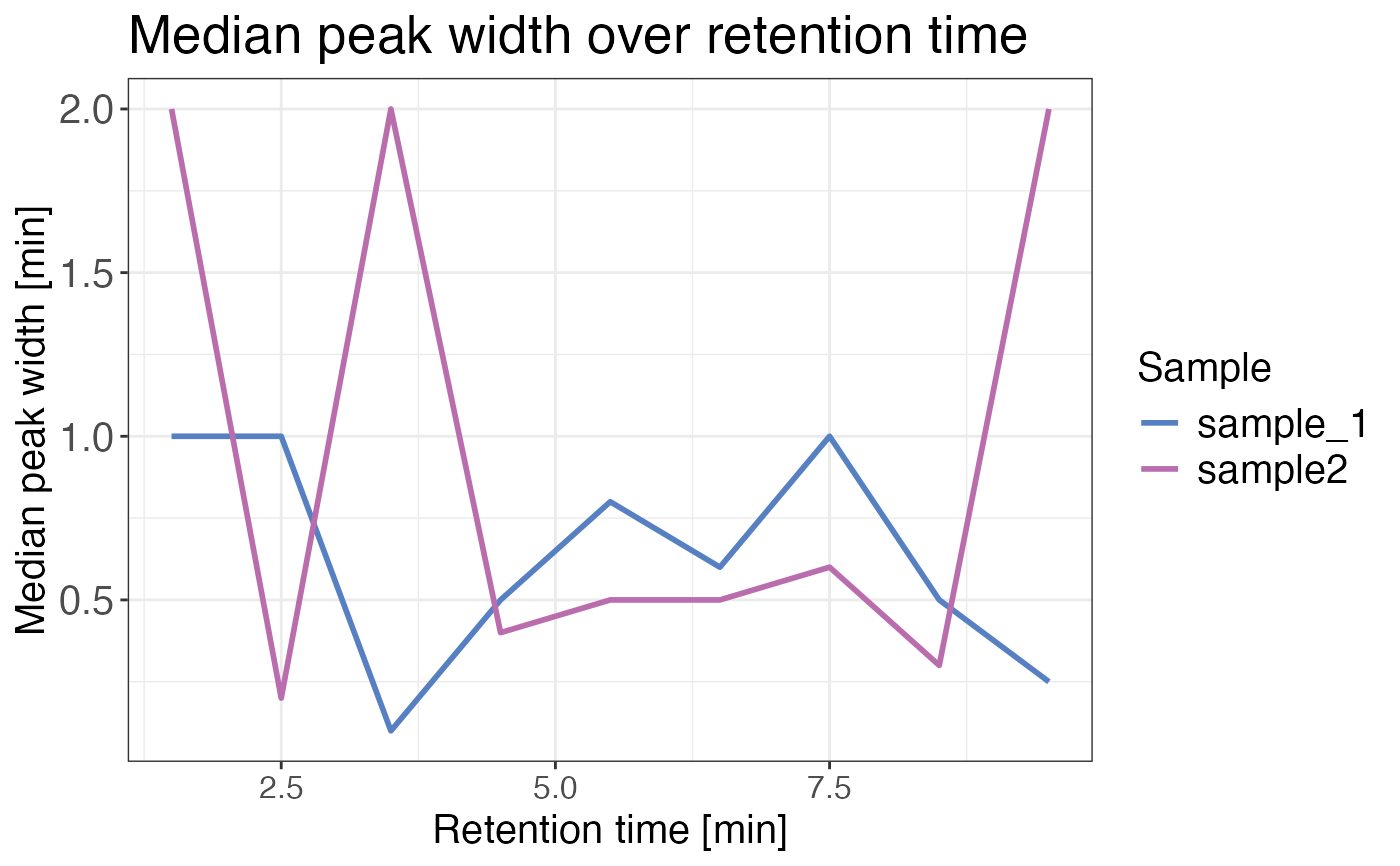
Plots one minute binned median precursor elution peak width over retention time for each sample.
qc_peak_width(
  data,
  sample,
  intensity,
  retention_time,
  peak_width = NULL,
  retention_time_start = NULL,
  retention_time_end = NULL,
  remove_na_intensities = TRUE,
  interactive = FALSE
)
Arguments
- data
a data frame containing at least sample names and protein IDs.
- sample
a character column in the
datadata frame that contains the sample names.- intensity
a numeric column in the
datadata frame that contains intensities. Ifremove_na_intensities = FALSE, this argument is not required.- retention_time
a numeric column in the
datadata frame that contains retention times of precursors.- peak_width
a numeric column in the
datadata frame that contains peak width information. It is not required ifretention_time_startandretention_time_endcolumns are provided.- retention_time_start
a numeric column in the
datadata frame that contains the start time of the precursor elution peak. It is not required if thepeak_widthcolumn is provided.- retention_time_end
a numeric column in the
datadata frame that contains the end time of the precursor elution peak. It is not required if thepeak_widthcolumn is provided.- remove_na_intensities
a logical value that specifies if sample/grouping combinations with intensities that are NA (not quantified IDs) should be dropped from the data frame. Default is TRUE since we are usually interested in the peak width of quantifiable data.
- interactive
a logical value that specifies whether the plot should be interactive (default is FALSE).
Value
A line plot displaying one minute binned median precursor elution peak width over retention time for each sample.
Examples
data <- data.frame(
  r_file_name = c(rep("sample_1", 10), rep("sample2", 10)),
  fg_quantity = c(rep(2000, 20)),
  eg_mean_apex_rt = c(rep(c(1, 2, 3, 4, 5, 6, 7, 8, 9, 10), 2)),
  eg_start_rt = c(0.5, 1, 3, 4, 5, 6, 7, 7.5, 8, 9, 1, 2, 2, 3, 4, 5, 5, 8, 9, 9),
  eg_end_rt = c(
    1.5, 2, 3.1, 4.5, 5.8, 6.6, 8, 8, 8.4,
    9.1, 3, 2.2, 4, 3.4, 4.5, 5.5, 5.6, 8.3, 10, 12
  )
)
qc_peak_width(
  data,
  sample = r_file_name,
  intensity = fg_quantity,
  retention_time = eg_mean_apex_rt,
  retention_time_start = eg_start_rt,
  retention_time_end = eg_end_rt
)