Calculates the proteome coverage for each samples and for all samples combined. In other words t he fraction of detected proteins to all proteins in the proteome is calculated.
qc_proteome_coverage(
  data,
  sample,
  protein_id,
  organism_id,
  reviewed = TRUE,
  plot = TRUE,
  interactive = FALSE
)
Arguments
- data
a data frame that contains at least sample names and protein ID's.
- sample
a character column in the
datadata frame that contains the sample name.- protein_id
a character or numeric column in the
datadata frame that contains protein identifiers such as UniProt accessions.- organism_id
a numeric value that specifies a NCBI taxonomy identifier (TaxId) of the organism used. Human: 9606, S. cerevisiae: 559292, E. coli: 83333.
- reviewed
a logical value that determines if only reviewed protein entries will be considered as the full proteome. Default is TRUE.
- plot
a logical value that specifies whether the result should be plotted.
- interactive
a logical value that indicates whether the plot should be interactive (default is FALSE).
Value
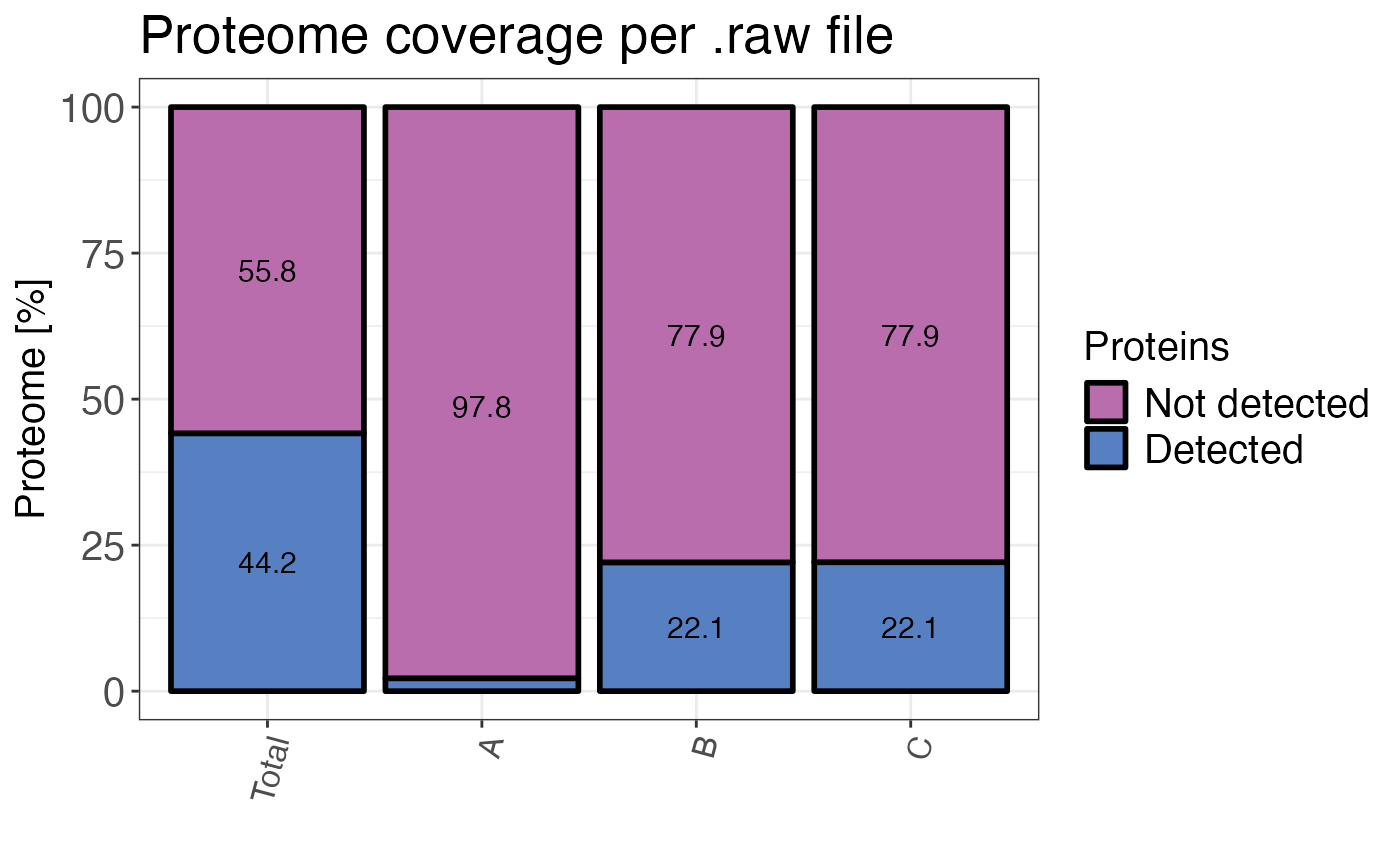
A bar plot showing the percentage of of the proteome detected and undetected in total
and for each sample. If plot = FALSE a data frame containing the numbers is returned.
Examples
# \donttest{
# Create example data
proteome <- data.frame(id = 1:4518)
data <- data.frame(
  sample = c(rep("A", 101), rep("B", 1000), rep("C", 1000)),
  protein_id = c(proteome$id[1:100], proteome$id[1:1000], proteome$id[1000:2000])
)

# Calculate proteome coverage
qc_proteome_coverage(
  data = data,
  sample = sample,
  protein_id = protein_id,
  organism_id = 83333,
  plot = FALSE
)
#> # A tibble: 8 × 3
#>   sample type                percentage
#>   <fct>  <fct>                    <dbl>
#> 1 A      proteins_detected         2.21
#> 2 A      proteins_undetected      97.8
#> 3 B      proteins_detected        22.0
#> 4 B      proteins_undetected      78.0
#> 5 C      proteins_detected        22.1
#> 6 C      proteins_undetected      77.9
#> 7 Total  proteins_detected        44.1
#> 8 Total  proteins_undetected      55.9

# Plot proteome coverage
qc_proteome_coverage(
  data = data,
  sample = sample,
  protein_id = protein_id,
  organism_id = 83333,
  plot = TRUE
)

# }
# }