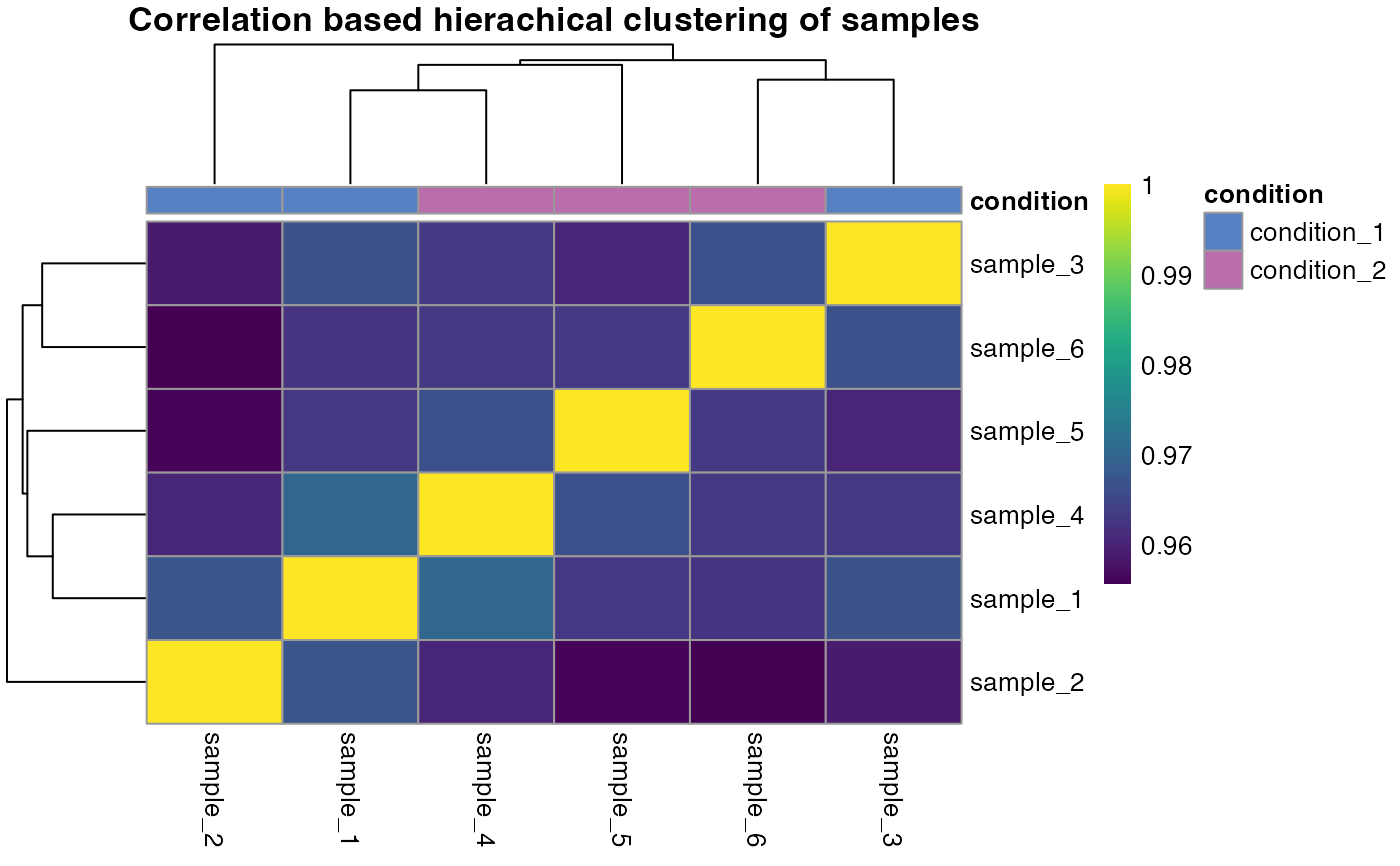
Correlation based hirachical clustering of samples
Source:R/qc_sample_correlation.R
qc_sample_correlation.RdA correlation heatmap is created that uses hirachical clustering to determine sample similarity.
qc_sample_correlation(
  data,
  sample,
  grouping,
  intensity_log2,
  condition,
  digestion = NULL,
  run_order = NULL,
  method = "spearman",
  interactive = FALSE
)
Arguments
- data
a data frame that contains at least the input variables.
- sample
a character column in the
datadata frame that contains the sample names.- grouping
a character column in the
datadata frame that contains precursor or peptide identifiers.- intensity_log2
a numeric column in the
datadata frame that contains log2 intensity values.- condition
a character or numeric column in the
datadata frame that contains the conditions.- digestion
optional, a character column in the
datadata frame that contains information about the digestion method used. e.g. "LiP" or "tryptic control".- run_order
optional, a character or numeric column in the
datadata frame that contains the order in which samples were measured. Useful to investigate batch effects due to run order.- method
a character value that specifies the method to be used for correlation.
"spearman"is the default but can be changed to"pearson"or"kendall".- interactive
a logical value that specifies whether the plot should be interactive. Determines if an interactive or static heatmap should be created using
heatmaplyorpheatmap, respectively.
Value
A correlation heatmap that compares each sample. The dendrogram is sorted by optimal leaf ordering.
Examples
# \donttest{
set.seed(123) # Makes example reproducible

# Create example data
data <- create_synthetic_data(
  n_proteins = 100,
  frac_change = 0.05,
  n_replicates = 3,
  n_conditions = 2,
  method = "effect_random"
)

# Create sample correlation heatmap
qc_sample_correlation(
  data = data,
  sample = sample,
  grouping = peptide,
  intensity_log2 = peptide_intensity_missing,
  condition = condition
)

# }
# }