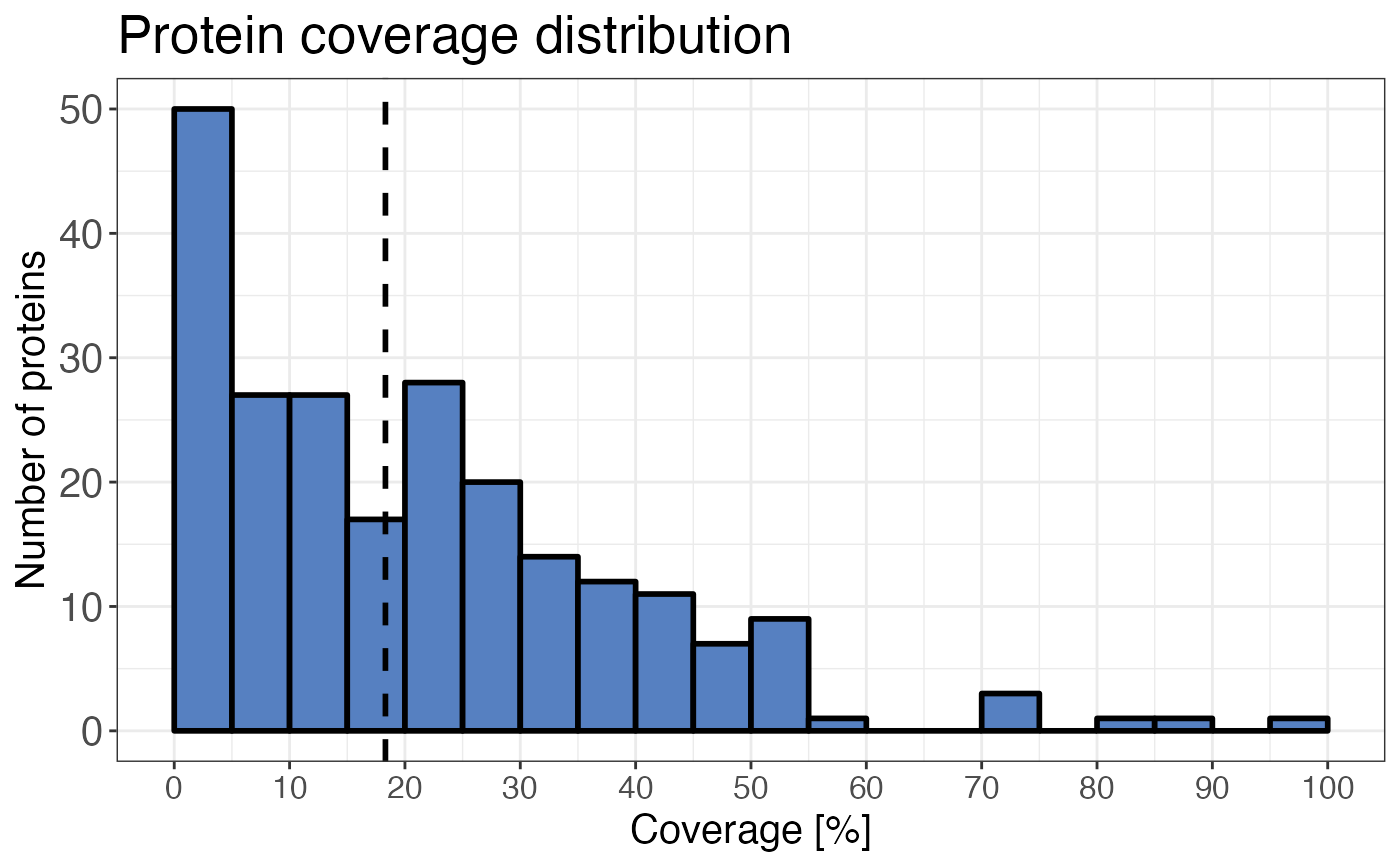
Plots the distribution of protein coverages in a histogram.
qc_sequence_coverage(
  data,
  protein_identifier,
  coverage,
  sample = NULL,
  interactive = FALSE
)
Arguments
- data
a data frame that contains at least the input variables.
- protein_identifier
a character column in the
datadata frame that contains protein identifiers.- coverage
a numeric column in the
datadata frame that contains protein coverage in percent. This information can be obtained using thesequence_coveragefunction.- sample
optional, a character or factor column in the
datadata frame that contains sample names. Please only provide this argument if you want to facet the distribution plot by sample otherwise do not provide this argument.- interactive
a logical value that specifies whether the plot should be interactive (default is FALSE).
Value
A protein coverage histogram with 5 percent binwidth. The vertical dotted line indicates the median.
See also
Examples
set.seed(123) # Makes example reproducible

# Create example data
data <- create_synthetic_data(
  n_proteins = 100,
  frac_change = 0.05,
  n_replicates = 3,
  n_conditions = 2,
  method = "effect_random"
)

# Plot sequence coverage
qc_sequence_coverage(
  data = data,
  protein_identifier = protein,
  coverage = coverage
)