Plots a volcano plot for the given input.
volcano_plot(
  data,
  grouping,
  log2FC,
  significance,
  method,
  target_column = NULL,
  target = NULL,
  facet_by = NULL,
  facet_scales = "fixed",
  title = "Volcano plot",
  x_axis_label = "log2(fold change)",
  y_axis_label = "-log10(p-value)",
  legend_label = "Target",
  colour = NULL,
  log2FC_cutoff = 1,
  significance_cutoff = 0.01,
  interactive = FALSE
)
Arguments
- data
a data frame that contains at least the input variables.
- grouping
a character column in the
datadata frame that contains either precursor or peptide identifiers.- log2FC
a character column in the
datadata frame that contains the log2 transfromed fold changes between two conditions.- significance
a character column in the
datadata frame that contains the p-value or adjusted p-value for the corresponding fold changes. The values in this column will be transformed using the -log10 and displayed on the y-axis of the plot.- method
a character value that specifies the method used for the plot.
method = "target"highlights your protein, proteins or any other entities of interest (specified in thetargetargument) in the volcano plot.method = "significant"highlights all significantly changing entities.- target_column
optional, a column required for
method = "target", can contain for example protein identifiers or a logical that marks certain proteins such as proteins that are known to interact with the treatment. Can also be provided ifmethod = "significant"to label data points in an interactive plot.- target
optional, a vector required for
method = "target". It can contain one or more specific entities of the column provided intarget_column. This can be for example a protein ID iftarget_columncontains protein IDs or TRUE or FALSE for a logical column.- facet_by
optional, a character column that contains information by which the data should be faceted into multiple plots.
- facet_scales
a character value that specifies if the scales should be "free", "fixed", "free_x" or "free_y", if a faceted plot is created. These inputs are directly supplied to the
scalesargument ofggplot2::facet_wrap().- title
optional, a character value that specifies the title of the volcano plot. Default is "Volcano plot".
- x_axis_label
optional, a character value that specifies the x-axis label. Default is "log2(fold change)".
- y_axis_label
optional, a character value that specifies the y-axis label. Default is "-log10(q-value)".
- legend_label
optional, a character value that specifies the legend label. Default is "Target".
- colour
optional, a character vector containing colours that should be used to colour points according to the selected method. IMPORTANT: the first value in the vector is the default point colour, the additional values specify colouring of target or significant points. E.g.
c("grey60", "#5680C1")to achieve the same colouring as the default for the "significant" method.- log2FC_cutoff
optional, a numeric value that specifies the log2 transformed fold change cutoff used for the vertical lines, which can be used to assess the significance of changes. Default value is 1.
- significance_cutoff
optional, a character vector that specifies the p-value cutoff used for the horizontal cutoff line, which can be used to assess the significance of changes. The vector can consist solely of one element, which is the cutoff value. In that case the cutoff will be applied directly to the plot. Alternatively, a second element can be provided to the vector that specifies a column in the
datadata frame which contains e.g. adjusted p-values. In that case the y-axis of the plot could display p-values that are provided to thesignificanceargument, while the horizontal cutoff line is on the scale of adjusted p-values transformed to the scale of p-values. The provided vector can be e.g.c(0.05, "adj_pval"). In that case the function looks for the closest adjusted p-value above and below 0.05 and takes the mean of the corresponding p-values as the cutoff line. If there is no adjusted p-value in the data that is below 0.05 no line is displayed. This allows the user to display volcano plots using p-values while using adjusted p-values for the cutoff criteria. This is often preferred because adjusted p-values are related to unadjusted p-values often in a complex way that makes them hard to be interpret when plotted. Default isc(0.01).- interactive
a logical value that specifies whether the plot should be interactive (default is FALSE).
Value
Depending on the method used a volcano plot with either highlighted targets
(method = "target") or highlighted significant proteins (method = "significant")
is returned.
Examples
set.seed(123) # Makes example reproducible
# Create synthetic data
data <- create_synthetic_data(
n_proteins = 10,
frac_change = 0.5,
n_replicates = 4,
n_conditions = 3,
method = "effect_random",
additional_metadata = FALSE
)
# Assign missingness information
data_missing <- assign_missingness(
data,
sample = sample,
condition = condition,
grouping = peptide,
intensity = peptide_intensity_missing,
ref_condition = "all",
retain_columns = c(protein, change_peptide)
)
#> "all" was provided as reference condition. All pairwise comparisons are
#> created from the conditions and assigned their missingness. The created
#> comparisons are:
#> condition_1_vs_condition_2
#> condition_1_vs_condition_3
#> condition_2_vs_condition_3
# Calculate differential abundances
diff <- calculate_diff_abundance(
data = data_missing,
sample = sample,
condition = condition,
grouping = peptide,
intensity_log2 = peptide_intensity_missing,
missingness = missingness,
comparison = comparison,
method = "t-test",
retain_columns = c(protein, change_peptide)
)
#> [1/2] Create input for t-tests ...
#> DONE
#> [2/2] Calculate t-tests ...
#> DONE
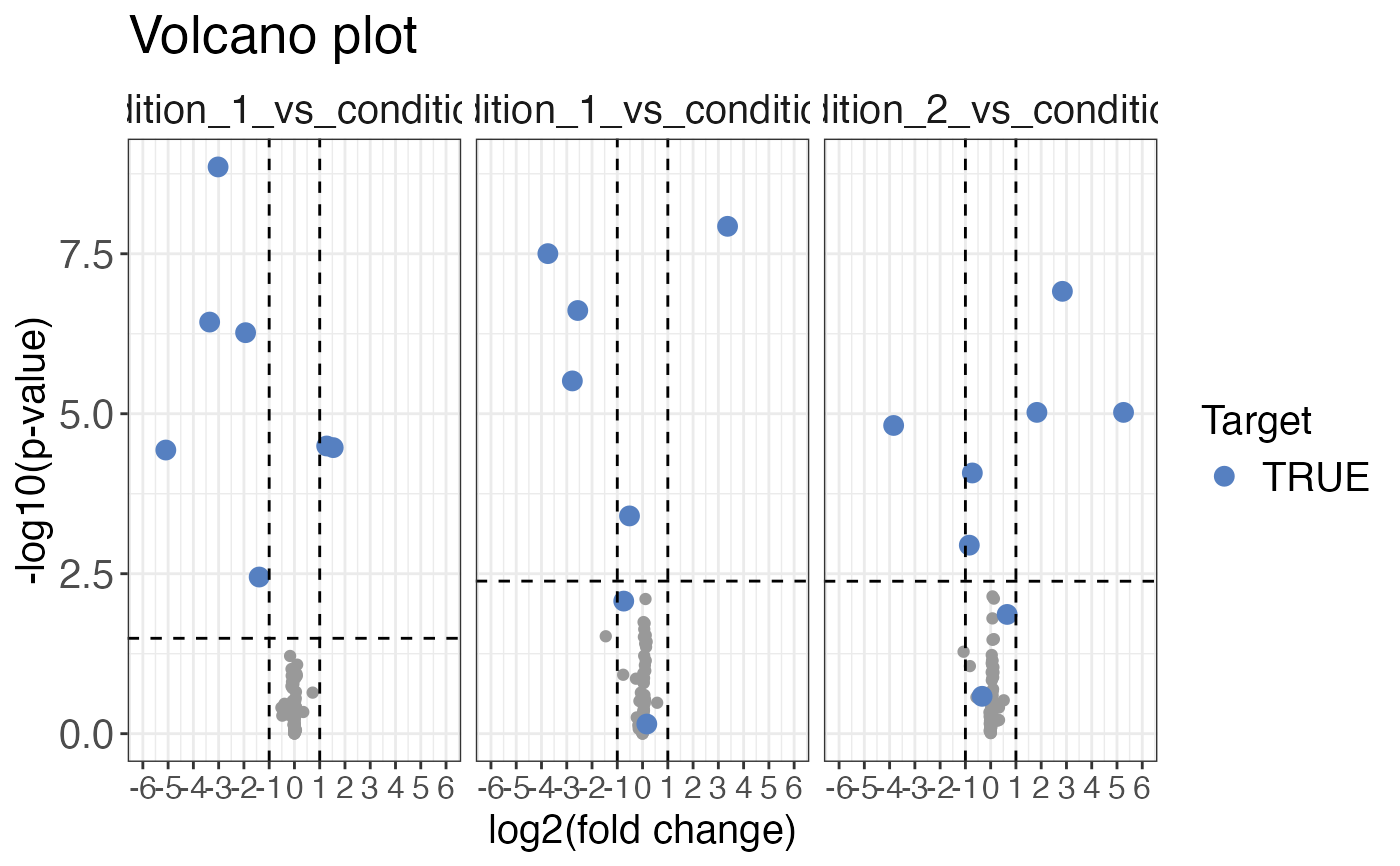
volcano_plot(
data = diff,
grouping = peptide,
log2FC = diff,
significance = pval,
method = "target",
target_column = change_peptide,
target = TRUE,
facet_by = comparison,
significance_cutoff = c(0.05, "adj_pval")
)