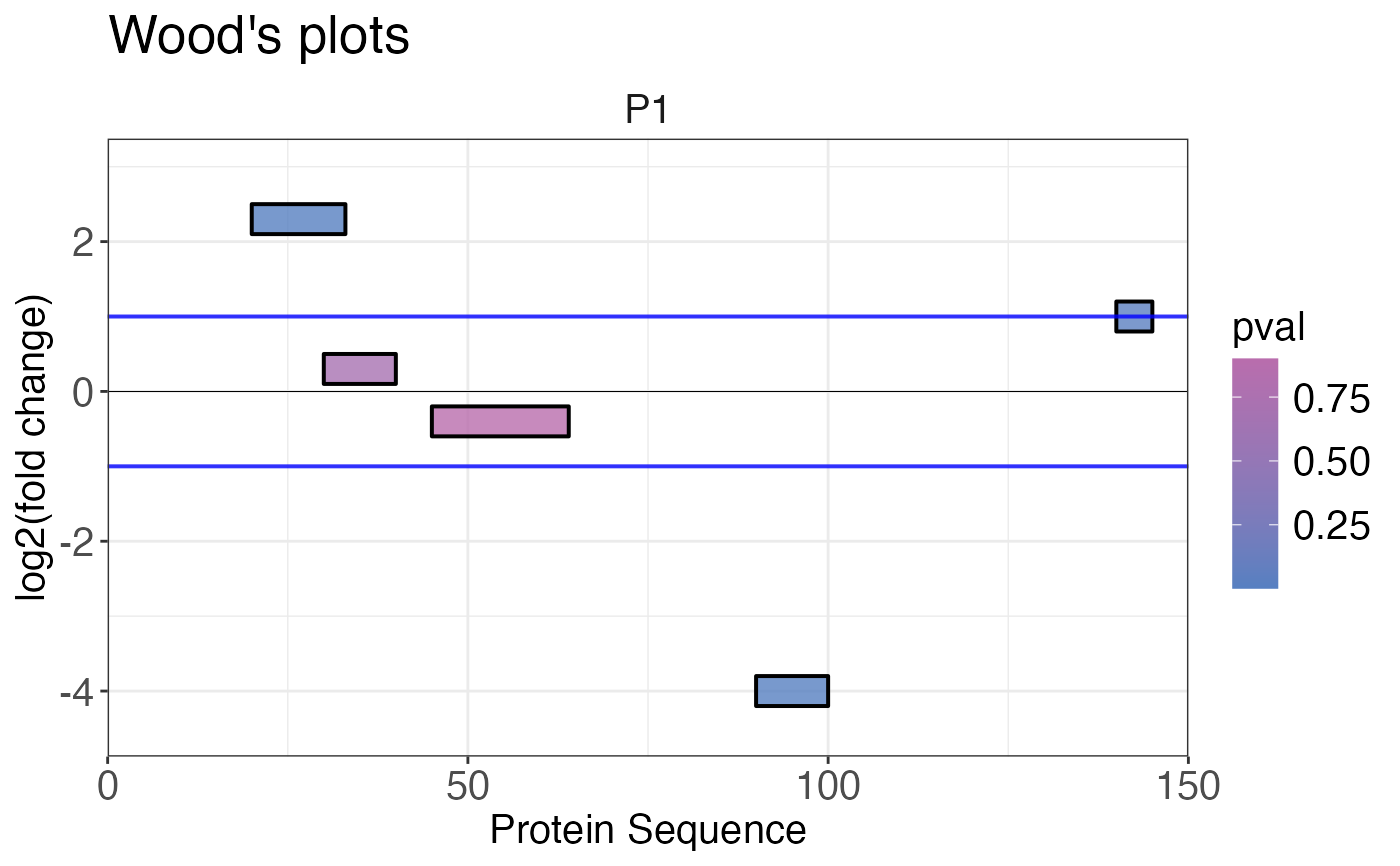
Creates a Woods' plot that plots log2 fold change of peptides or precursors along the protein sequence. The peptides or precursors are located on the x-axis based on their start and end positions. The position on the y-axis displays the fold change. The vertical size (y-axis) of the box representing the peptides or precursors do not have any meaning.
woods_plot(
  data,
  fold_change,
  start_position,
  end_position,
  protein_length,
  coverage = NULL,
  protein_id,
  targets = "all",
  facet = TRUE,
  colouring = NULL,
  fold_change_cutoff = 1,
  highlight = NULL,
  export = FALSE,
  export_name = "woods_plots"
)
Arguments
- data
a data frame that contains differential abundance, start and end peptide or precursor positions, protein length and optionally a variable based on which peptides or precursors should be coloured.
- fold_change
a numeric column in the
datadata frame that contains log2 fold changes.- start_position
a numeric column in the
datadata frame that contains the start positions for each peptide or precursor.- end_position
a numeric column in the
datadata frame that contains the end positions for each peptide or precursor.- protein_length
a numeric column in the
datadata frame that contains the length of the protein.- coverage
optional, a numeric column in the
datadata frame that contains coverage in percent. Will appear in the title of the Woods' plot if provided.- protein_id
a character column in the
datadata frame that contains protein identifiers.- targets
a character vector that specifies the identifiers of the proteins (depending on
protein_id) that should be plotted. This can also be"all"if plots for all proteins should be created. Default is"all".- facet
a logical value that indicates if plots should be summarised into facets of 20 plots. This is recommended for many plots. Default is
facet = TRUE.- colouring
optional, a character or numeric (discrete or continous) column in the data frame containing information by which peptide or precursors should be coloured.
- fold_change_cutoff
optional, a numeric value that specifies the log2 fold change cutoff used in the plot. The default value is 2.
- highlight
optional, a logical column that specifies whether specific peptides or precursors should be highlighted with an asterisk.
- export
a logical value that indicates if plots should be exported as PDF. The output directory will be the current working directory. The name of the file can be chosen using the
export_nameargument. Default isexport = FALSE.- export_name
a character vector that provides the name of the exported file if
export = TRUE. Default isexport_name = "woods_plots"
Value
A list containing Woods' plots is returned. Plotting peptide or precursor log2 fold changes along the protein sequence.
Examples
# Create example data
data <- data.frame(
  fold_change = c(2.3, 0.3, -0.4, -4, 1),
  pval = c(0.001, 0.7, 0.9, 0.003, 0.03),
  start = c(20, 30, 45, 90, 140),
  end = c(33, 40, 64, 100, 145),
  protein_length = c(rep(150, 5)),
  protein_id = c(rep("P1", 5))
)

# Plot Woods' plot
woods_plot(
  data = data,
  fold_change = fold_change,
  start_position = start,
  end_position = end,
  protein_length = protein_length,
  protein_id = protein_id,
  colouring = pval
)
#> $`1`

#>
#>